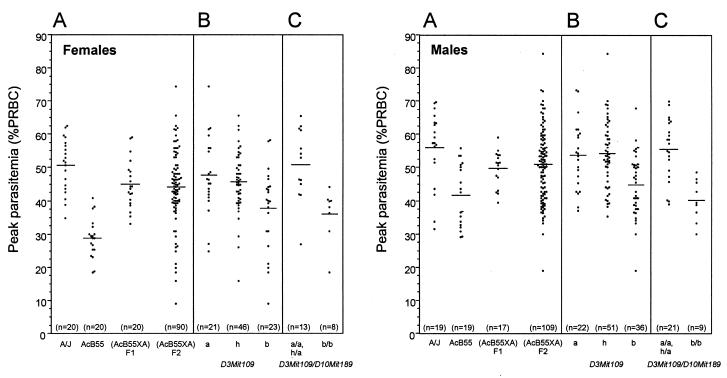
Figure 2.
Susceptibility of (AcB55 × A)F2 mice to infection with P. chabaudi AS. Individual mice from the F1 and F2 populations as well a parental controls were infected i.p. with 106 parasitized RBC, and daily parasitemia as well as death from infection were recorded. (A) Peaks of parasitemia are shown separately for males and females of each group. To visualize the contribution of the Chr.3 locus on peak parasitemia, and the additive effect of the Chr.10 locus, mice of the F2 were separated according to their genotype at marker D3Mit109 (B) and in combination with marker D10Mit189 (C). Letters a and b represent alleles of A and B6 origins, respectively, and h represents heterozygotes. Each dot represents one mouse; means are indicated by horizontal lines.

