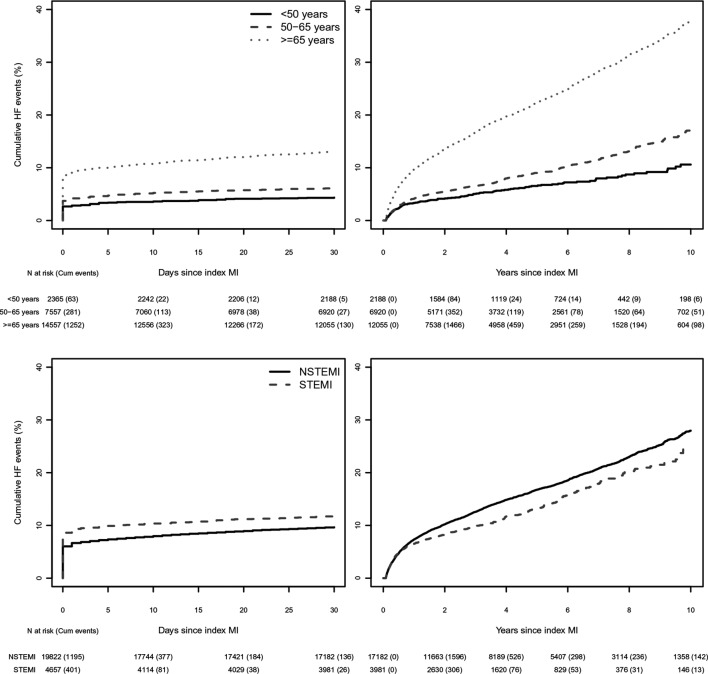
Figure 3.
Incidence of HF after index MI by group. Kaplan-Meier curves for crude incidence of HF after MI stratified by group. Top left panel: 30-day follow-up after index MI stratified by age group. Top right panel: 10-year follow-up (median follow-up time was 3.7 years) in 30-day event-free patients stratified by age group. Log-rank test of patients aged ≥65 years compared with patients aged 50–65 years (P<0.001). Bottom left panel: 30-day follow-up after index MI stratified by MI type. Bottom right panel: 10-year follow-up (median follow-up time was 3.7 years) in patients who survived the first 30 days and did not develop HF during the first 30 days stratified by MI type. Log-rank test of NSTEMI compared with STEMI (P<0.001). ‘n at risk’ represents the number of subjects at risk at a certain time point, with the cumulative number of events since the previous time points presented between brackets. HF, heart failure; MI, myocardial infarction; NSTEMI, non-ST-segment elevation myocardial infarction; STEMI, ST-segment elevation myocardial infarction.

