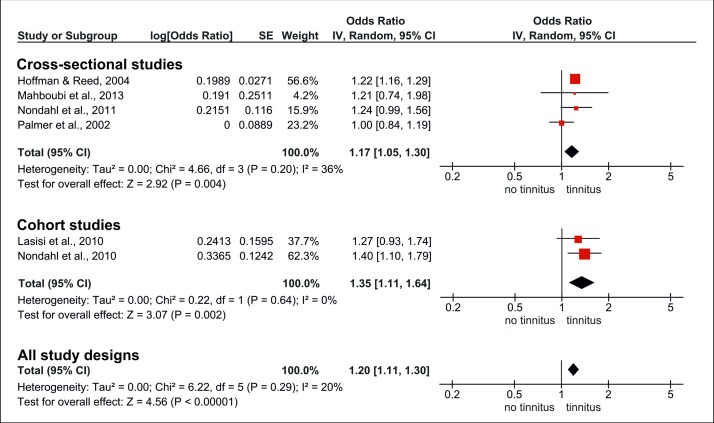
Figure 6.
Meta-analysis of tinnitus in ever-smokers. Studies were combined using a random effects generic inverse variance model. The first two blocks show forest plots of cross-sectional and cohort studies separately. The effect size of each study is illustrated on a logarithmic scale by a red square, whose surface is proportional to the weight of the study. ORs >1 show a positive association of smoking on tinnitus. The horizontal bars represent the 95% CI. Summary estimates are represented by a black diamond. The third diamond illustrates the summary estimate of the comparison with all study designs. The ‘P’ value refers to the test of heterogeneity. This means that a statistical significant P value indicates heterogeneity, whereas a non-significant value does not rule out heterogeneity.

