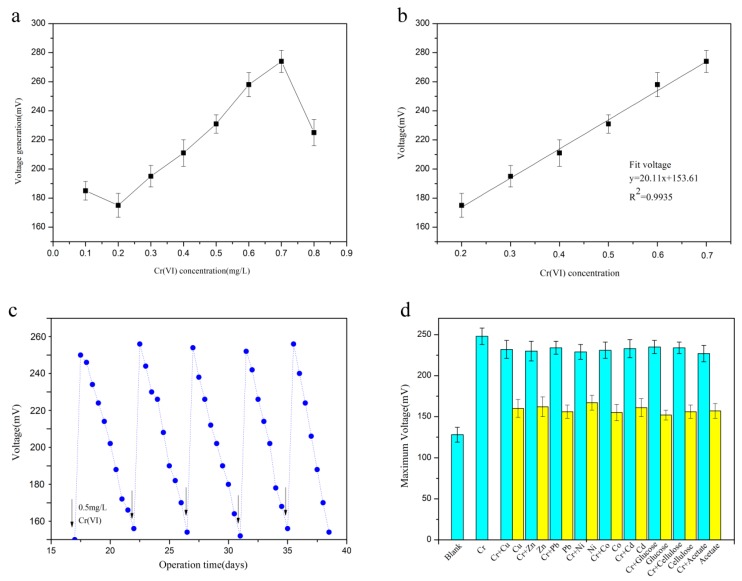
Figure 5.
Calibration of the biosensor under the conditions at pH 6.4, temperature of 25 °C and external resistance of 98.2 Ω. (a) The maximum voltage at different concentrations of Cr(VI). (b) The correlations between the Cr(VI) concentrations and the maximum voltages. (c) Voltage generation in the SMFC with the Cr(VI) concentration of 0.5 mg/L over a period of five operational cycles. Arrows indicate the replacement of the catholyte solution with a solution containing 0.5 mg/L Cr(VI). (d) Interference experiment design at pH 6.4 and 25 °C with an external resistance of 98.2 Ω. Maximum voltage generation of the SMFC in the presence of various other factors (0.5 mg/L) in the cathode. The standard deviation was representing as error bars.

