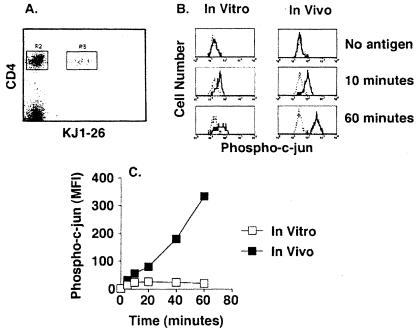
Figure 2.
Comparison of c-jun phosphorylation after in vitro or in vivo stimulation of naive T cells with peptide antigen. (A) A representative flow cytometry dot plot showing CD4 and KJ1–26 staining of spleen cells from transferred recipients. The gating strategy discriminates transferred DO11.10 CD4+, KJ1–26+ cells (R3) from the recipient's CD4+, KJ1–26− cells (R2). (B) Antiphospho c-jun staining of DO11.10 (bold line) or recipient CD4 T cells (dashed line) from the same sample after initiation of in vitro culture with ovalbumin peptide-pulsed splenocytes (Left) or i.v. injection of ovalbumin peptide (Right). (C) Time course of c-jun phosphorylation after in vitro (open squares) or in vivo (filled squares) stimulation with ovalbumin peptide. The difference between the phospho-c-jun signal (mean fluorescence intensity, MFI) in DO11.10 and recipient CD4 T cells is shown.

