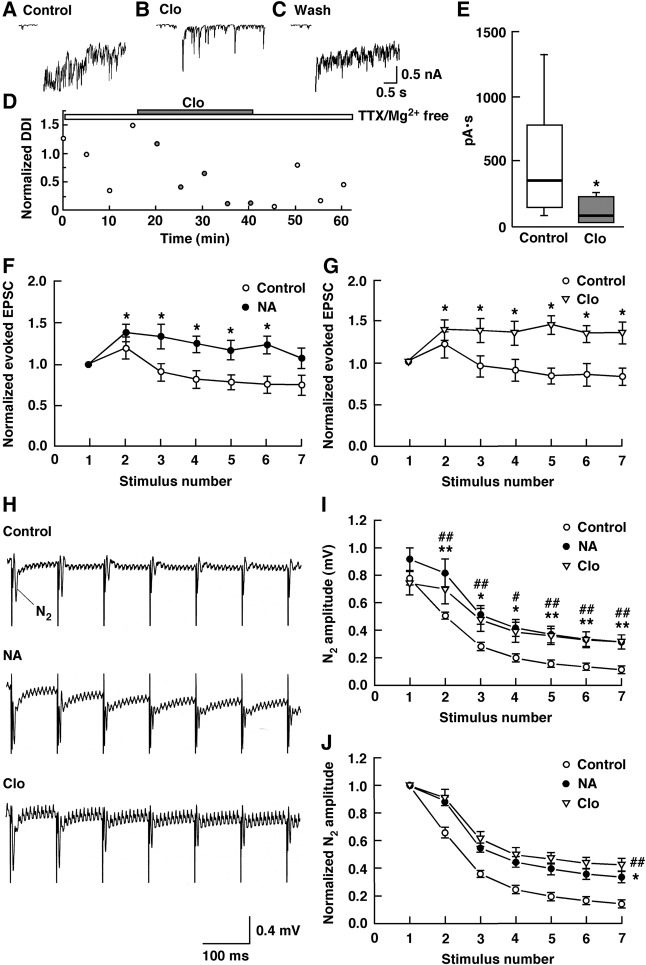
Figure 5.
NA disinhibited MCs, enhancing GC responses to 10-Hz stimulation. (A) IPSCs recorded from an MC bathed in ACSF containing no Mg2+. (B) IPSCs recorded from the same cell bathed in ACSF containing clonidine (Clo, 5 µM), and no Mg2+. (C) IPSCs observed after the removal of Clo. (D) Normalized magnitudes of the DDI evoked by voltage steps. The magnitudes of the DDI were normalized to the mean magnitude recorded in ACSF containing TTX and no Mg2+. All traces and data points were obtained from the same cell. To illustrate the synaptic component of the evoked responses more clearly, the Ca2+ current generated during the voltage step is removed from the traces. Bars above the scatter graph indicate the periods of extracellular application of TTX, Mg2+-free ACSF and Clo. (E) Summarized results showing that Clo produced a significant decrease in the DDI. Data are given as box plots. The line inside the boxes marks the median, and the box boundaries indicate the 25th and 75th percentiles. Error bars the range from minimum to maximum. (*) P < 0.05 versus the control. (F,G) Normalized peak amplitudes of the consecutive GC eEPSCs elicited by 10-Hz stimulation of the LOT before and during bath application of NA (10 µM; F) or Clo (5 µM; G). (*) P < 0.05 versus the first response. (H) Local field potential records showing changes in the amplitude of the consecutive N2 evoked by 10-Hz stimulation of the LOT in the presence of ACSF (Control), NA (10 µM) or Clo (5 µM). (I) NA attenuated the reduction in the amplitude of the consecutive N2 evoked by 10-Hz stimulation of the LOT, and this effect was mimicked by Clo. (*) P < 0.05, (**) P < 0.01 for NA versus the control; (#) P < 0.05, (##) P < 0.01 for Clo versus the control. (J) Decay time courses of N2 amplitudes. The data shown in (I) were normalized to the first N2 amplitudes. Under control conditions, the decay time course of N2 amplitudes was fitted by a single exponential with a time constant of 272 ± 21 ms. The decay time constants of N2 amplitudes were significantly larger in the presence of NA or Clo than in the presence of ACSF (Control). (*) P < 0.05 for NA versus the control; (##) P < 0.01 for Clo versus the control.

