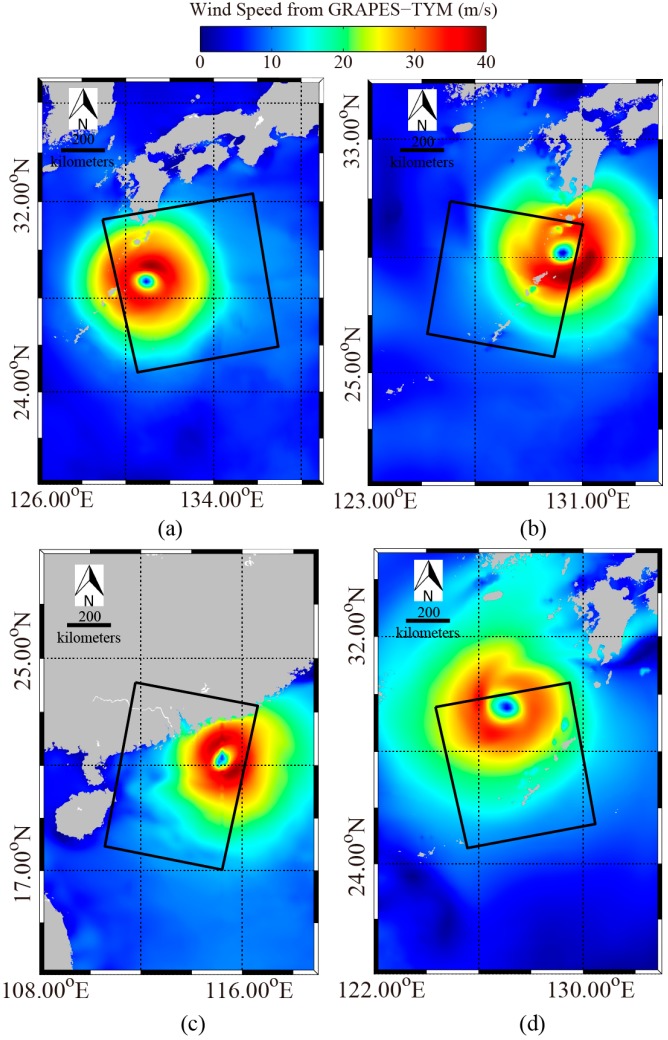
Figure 10.
GRAPES-TYM wind maps, in which the rectangles represent the coverage of the corresponding three VH-polarization GF-3 SAR images in Figure 3. (a) GRAPES-TYM wind maps of typhoon e on 4 August 2017 at 09:00 UTC. (b) GRAPES-TYM wind maps of typhoon Noru on 4 August 2017 at 21:00 UTC. (c) GRAPES-TYM wind maps of typhoon Hato on 22 August 2017 at 22:00 UTC. (d) GRAPES-TYM wind maps of typhoon Talim on 16 September 2017 at 09:00 UTC.

