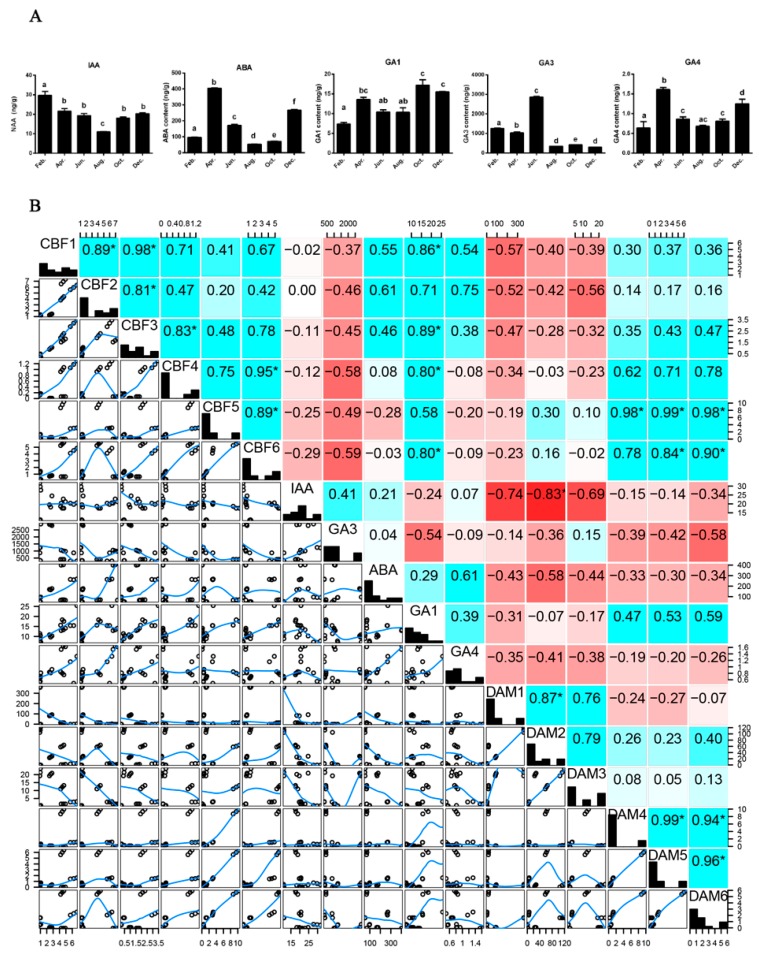
Figure 5.
Hormone contents in stems and correlation matrix between hormones and genes. (A) the levels of IAA, ABA, GA1, GA3, GA4 in stems and over a time course of a year during which stems were experienced dormancy and dormancy release to growth and development; (B) correlation matrix between hormones and genes expression levels. The correlation values were calculated by spearman method and established by red (negative correlations) and blue (positive correlations) blocks. Stars above the numbers (*) means significant correlations.

