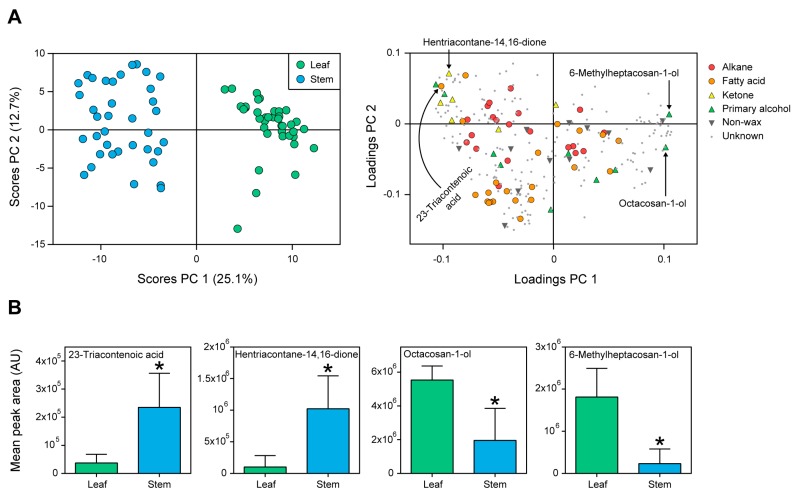
Figure 4.
Metabolite distribution in leaf and stem cuticles. Multivariate analysis demonstrating specific composition in cuticular wax chemistry between leaf and stem surfaces of wheat. (A) Principal component analysis (PCA) of the four cultivars showed that most metabolite (wax and non-wax) variation was due to differences between leaves and stems (principal component, or PC scores, left). Each PC score point represents the metabolite profile for a single biological replicate (n = 9–11 replicates per cultivar). Loadings were colored by wax type and include primary alcohols, ketones, and fatty acids. Example wax metabolites are indicated by arrows. (B) Box plots of example waxes that varied between leaf and stem cuticles. Metabolite values are reported as the mean content across all cultivars ± standard error of the mean (n = 40 biological replicates per tissue). Asterisks indicate variation between tissues (ANOVA, FDR-adjusted p < 0.05). Abbreviations/Notations: PC = principal component; AU = arbitrary unit; unknown = unknown metabolite, no annotation.

