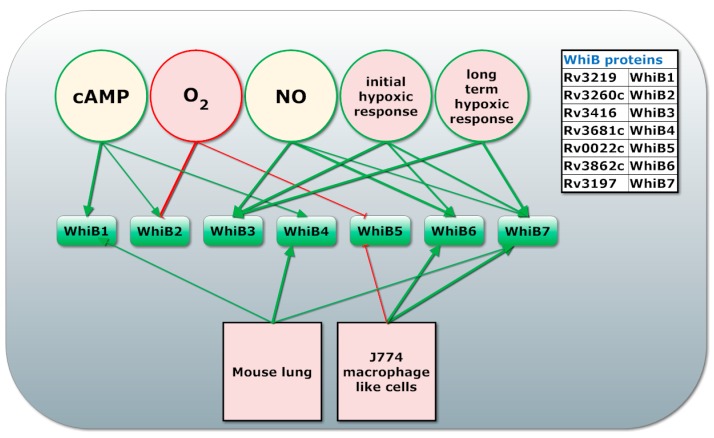
Figure 2.
WhiB1-7 transcriptional response to environmental stresses. Proteins from the WhiB family are presented in the squares. The circles in the top indicate environmental cues (O2, NO, cAMP availability) or infection stages (initial or long term hypoxic response). Squares represent different environments (mouse lung and JJ774 macrophage like cells). Arrows indicated regulation (green for induction, red for inhibition of transcription) with the line width indicating the strength of the interaction based on the fold change of their transcript level in a given conditions [68,118].

