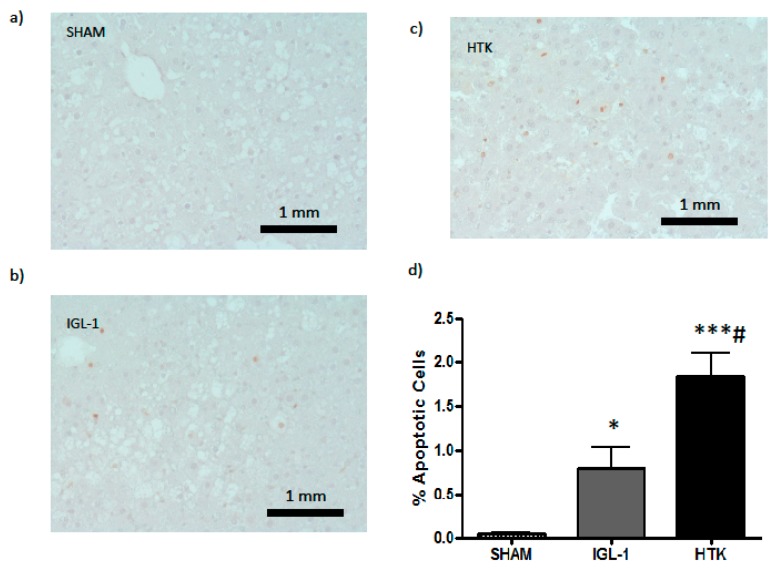
Figure 6.
Apoptotic hepatic cells detected with TUNEL assay. (a) SHAM, (b) IGL-1, and (c) HTK. (d) Apoptotic cells (stained with red) were counted and damage was assessed as a percentage of positive cells for each group. Bar graphs represent the mean ±SD. * p < 0.05 vs. SHAM, *** p < 0.0005 vs. SHAM, # p < 0.05 vs. IGL-1.

