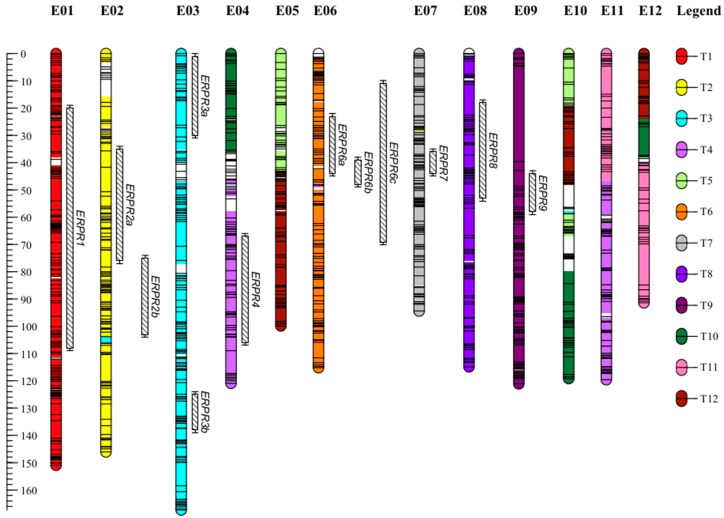
Figure 1.
Genetic map of EG203 × MM738 doubled haploid population anchored on eggplant and tomato chromosomes. The figure shows the 12 linkage groups (LG)–chromosomes from E01 to E12 and their corresponding tomato chromosomes individualized by a color code (key on the right of the figure). The markers’ positions are symbolized by horizontal lines on the LG bars; the markers’ names were not included to facilitate map legibility. The list and positions of all markers can be found in Table S3. The detected quantitative trait loci (QTLs) and their confidence intervals are represented on the right of their respective chromosomes by black hatched bars, and their names are on the right of each QTL bar.

