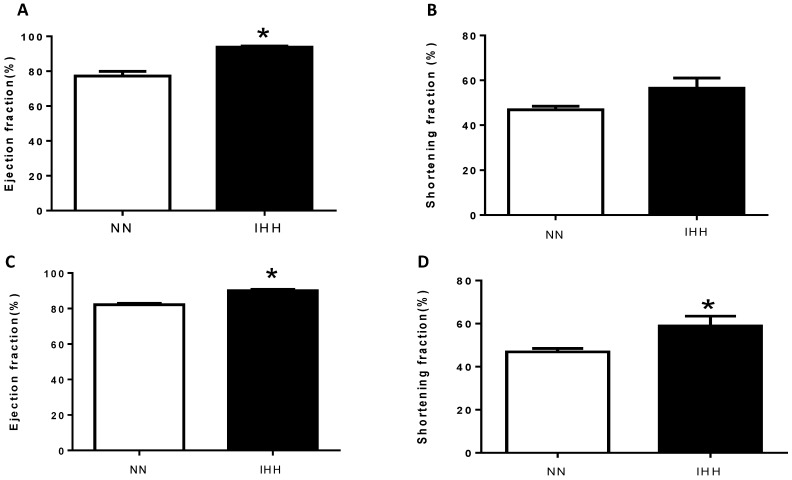
Figure 1.
Echochardiographic heart function. The left heart function was evaluated through the ejection fraction (EF%, (A,C)) and shortening fraction (SF%, (B,D)). The first measurement was performed following the first cycle of intermittent hypobaric hypoxia (A,B) and the second one was performed following the fourth intermittent hypobaric hypoxia (IHH) cycle (C,D). Data are expressed in mean ± SEM. Significant differences (* p ≤ 0.05) vs. Normobaric normoxia.

