Figure 2.
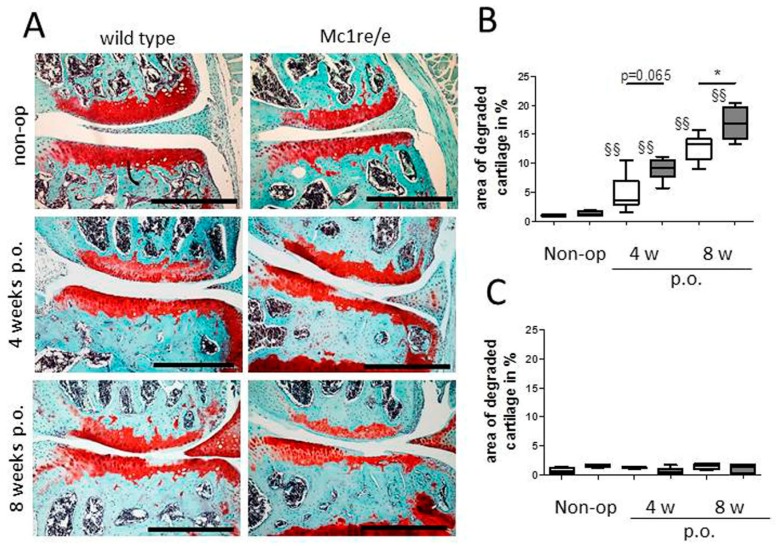
Assessment of cartilage degradation after osteoarthritis (OA) induction in Mc1re/re mice. (A) Representative images-stained with Safranin O/Fast green-of the medial area from frontal sections of right knee joints from non-operated (non-op) and from mice 4 and 8 weeks after osteoarthritis induction via destabilization of the medial meniscus (DMM, p.o., post-operation) show disease progression over the time. (B,C) 5–6 sections in 60–80 µm intervals of right knees (DMM, B) and left knees (Sham, C) show percentages of degraded cartilage area which indicated an OA-progression over time in wildtype (WT) (p = 0.0043) and Mc1re/e (p = 0.0095) compared to non-operated controls. Mc1re/e mice had more degraded cartilage four weeks (p = 0.0649) and eight weeks (p = 0.0411) after OA-induction compared to WT animals. Sham operated knee joints showed similar area of degraded cartilage compared to non-operated controls. White bars indicate wild type and grey bars indicate mutant group. Bars = 500 µm, §§ p <0.01 4/8 weeks post-surgery vs. non-operated, * p < 0.05 wild type vs. Mc1re/e. Adapted from Lorenz et al. [95].

