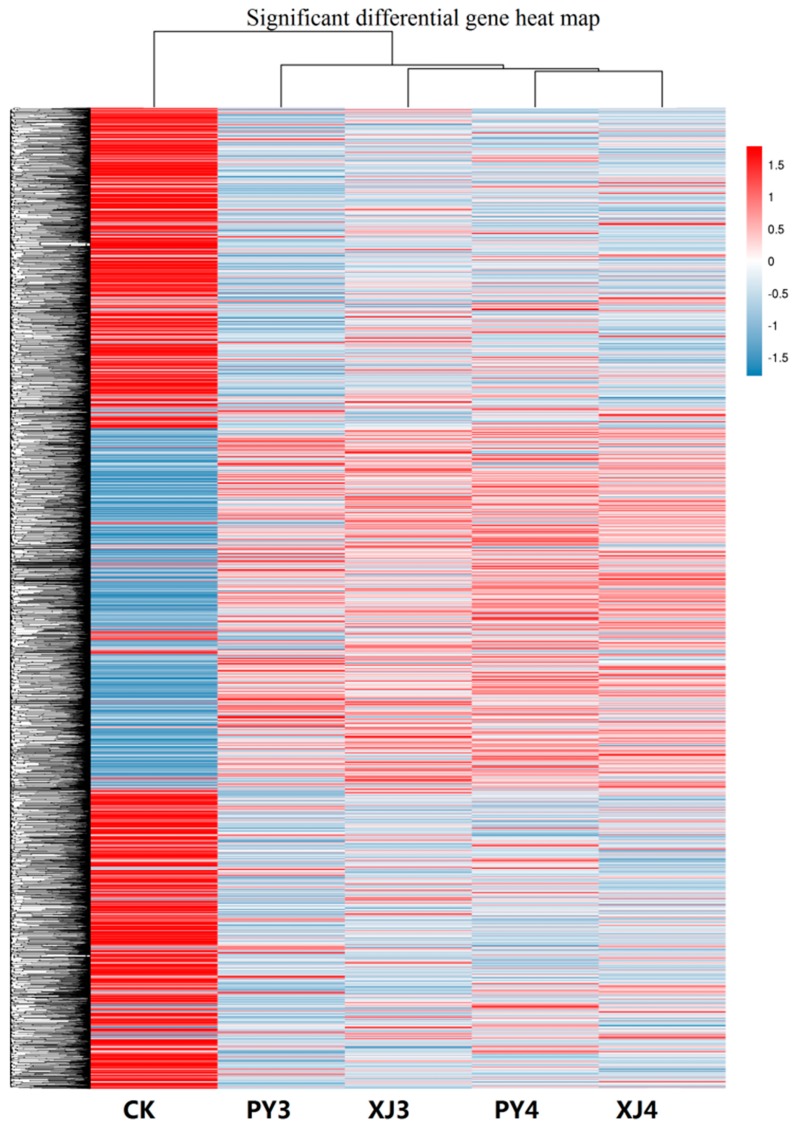
Figure 2.
Cluster of significant differentially expressed genes of the five experimental samples. The RPKM (reads per kb per million reads) values of unigenes were used for hierarchical cluster analysis. Expression level was showed by different colors, the redder the higher expression and the bluer the lower. Five treatments were set: CK, only carved; PY3, inoculated with water and sampled 48 h after inoculation; PY4, inoculated with water and sampled at 96 h; XJ3, inoculated with Psa and sampled at 48 h; XJ4, inoculated with Psa and sampled at 96 h.

