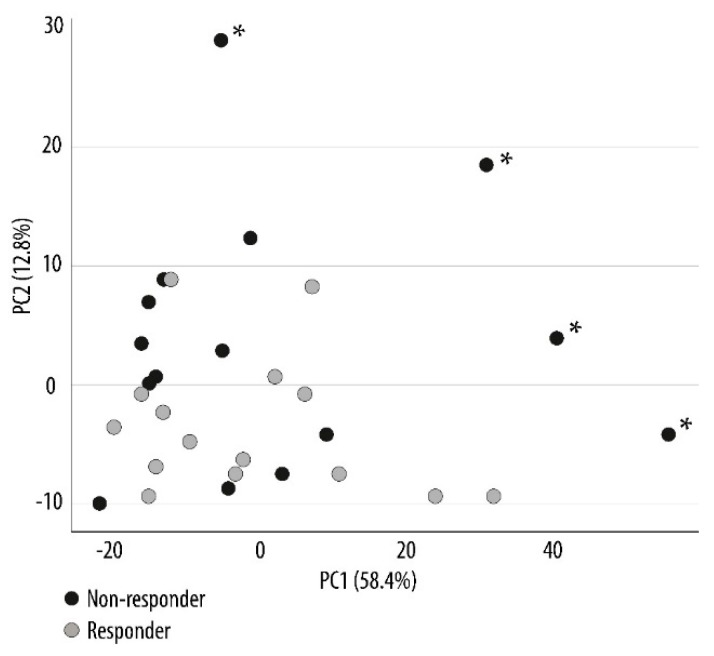
Figure 2.
Principal component analysis (PCA) comparing the metabolic profiles of responders and non-responders to PI3K-mTOR inhibitors. The analysis was performed to generate an overview of the metabolic variance among the entire set of samples. Prior to this analysis, primary AML cells from 30 patients were separated into two contrasting groups based on their susceptibility to the in vitro antiproliferative effect of pathway inhibitors. The metabolic profiles for the primary AML cells derived from patients being susceptible (15 responders; grey circle) or resistant (15 non-responders; black circle) to PI3K-mTOR inhibitors were compared. The PCA depicts 71.2% (58.4 + 12.8% as indicated at the X and Y axis) of all variances in the data set. A separation of four non-responders (indicated by the asterisks *) from the rest of the sample was seen. Each circle represents the results for one patient.

