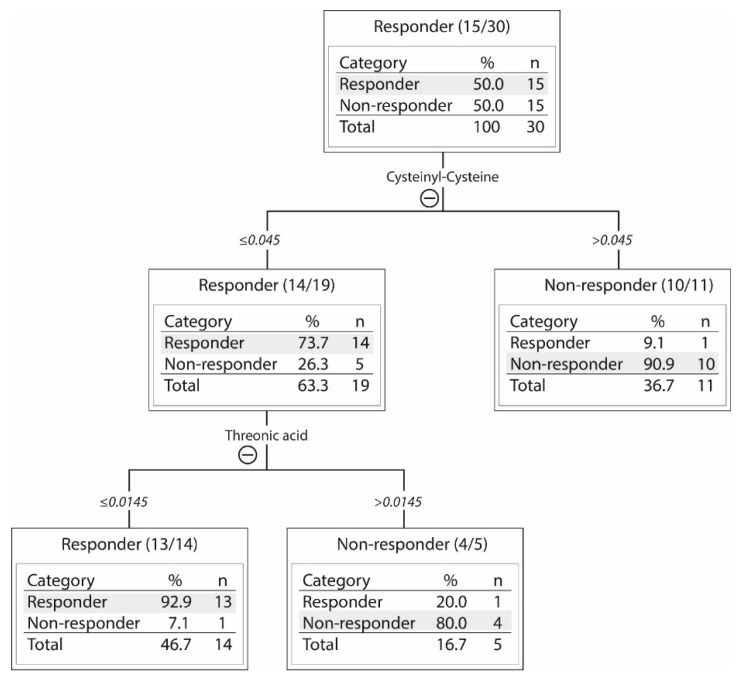
Figure 3.
A decision tree analysis of the metabolic differences between 15 responders and 15 non-responders to PI3K-Akt-mTOR inhibition. The levels of two metabolites, cysteinyl-cysteine and threonic acid, allowed for discrimination between responders and non-responders. The 30 patients (see the upper box) were first classified into two subsets based on their cysteinyl-cysteine levels (≤ or >0.045). In the box with high cysteinyl-cysteine (>0.045; right box), there were 10 non-responders and 1 responder. The 19 patients (14 responders and 5 non-responders) with low levels of cysteinyl-cysteine (≤0.045; left box) were further subclassified into two subsets based on the level of threonic acid (≤ or >0.0145). Thirteen of the 14 responders with low levels of cysteinyl-cysteine also showed low levels of threonic acid (≤0.0145; left box). Whereas four of five non-responders among the 19 patients with low levels of cysteinyl-cysteine showed high levels of threonic acid (>0.0145; right box). Approximately ninety percent of patients were then correctly classified as responders or non-responders.

