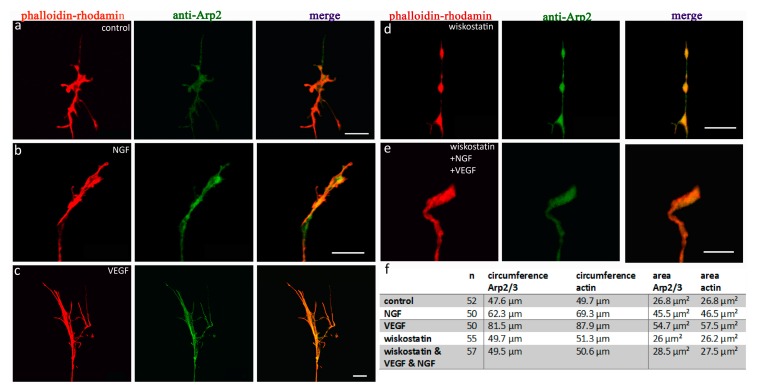
Figure 5.
Distributional changes of anti-Arp2 and phalloidin rhodamine, subsequent to the application of NGF, VEGF, or wiskostatin. (a) Controls (n = 52) show a congruent distribution pattern of Arp2 (green) and actin (red). Arp2 showed a stronger fluorescent level in lamellipodia under every condition examined. Stimulation with NGF (b) (n = 50) and additional VEGF (c) (n = 50) lead to a highly significant increase in the mean circumference and area in both Arp2 and actin compared to standard conditions (*** = p < 0.001). After inhibition of Arp2/3-signaling by application of the N-WASP-inhibitor (d) wiskostatin under control conditions (n = 55) and after stimulation with VEGF plus NGF (e) (n = 57), the growth cones did not differ significantly from controls. The table (f) shows the statistical data for growth cones, stained with anti-Arp2. The graphs (g) show the mean circumference and the mean area (h) of the analyzed growth cones. Scale bars = 10 µm. Error bars = SEM.


