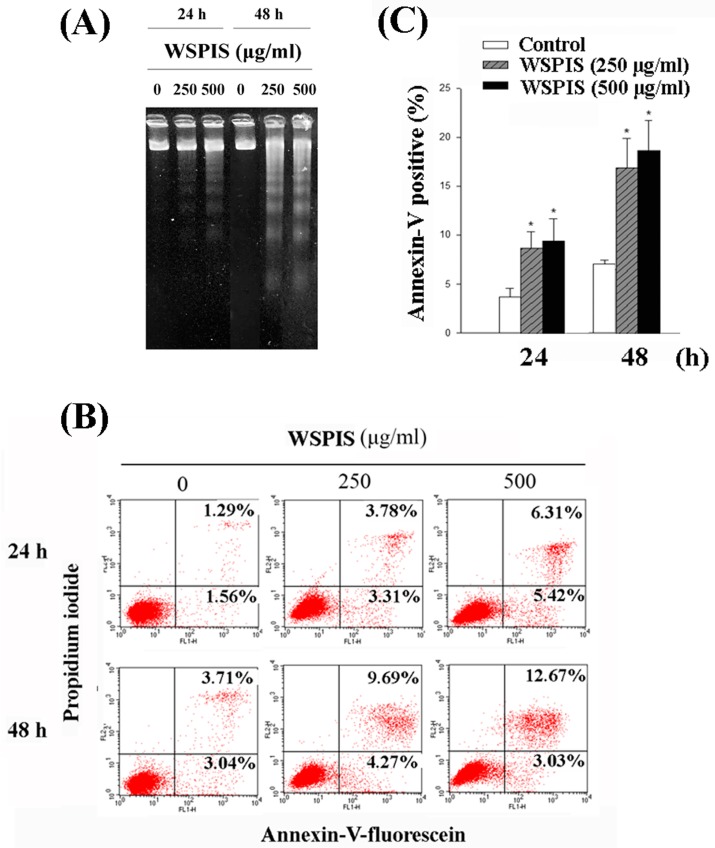
Figure 3.
Apoptotic effects of WSPIS in THP-1 cells. Cells were treated with various concentrations of WSPIS (250 and 500 µg/mL) for 24 and 48 h. (A) DNA fragmentation was analyzed by agarose gel electrophoresis. Data are representative of three independent experiments. (B) Annexin-V-positive cells were analyzed by flow cytometry after annexin-V/propidium iodide staining. (C) Apoptotic cells (annexin-V-positive) are expressed as mean ± SD of three independent experiments. * denotes the data that are significantly different from control at p < 0.05.

