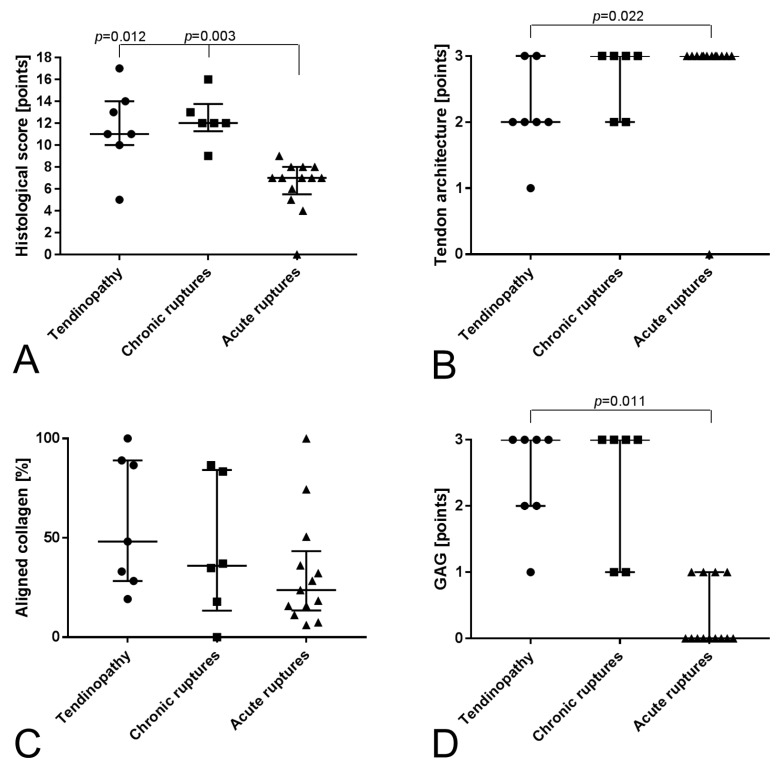
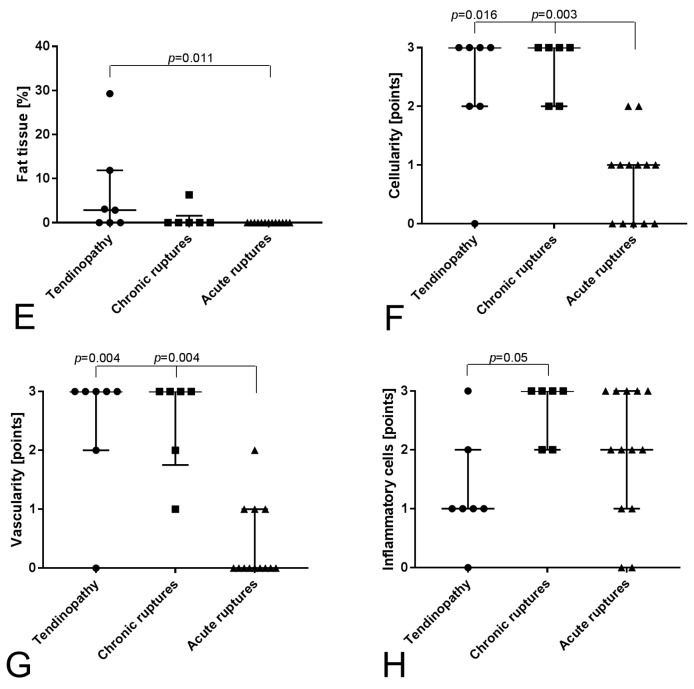
Figure 2.
Evaluation of histological score: (A) Total histological score reaching 18 points as maximum, which would indicate a highly degenerated tendon. (B) Tendon architecture as indicator for the disturbance of the tendon structure (0–3 points). (C) Amount of aligned collagen quantified using ImageJ (0–100%). (D) GAG content (0–3 points, MP staining). (E) Fat tissue quantified using ImageJ (0–100%, MP staining). (F) Cellularity (0–3 points, HE staining). (G) Vascularity (0–3 points, αSMA staining). (H) Inflammatory cells (not included in histological score, CD45 staining). Data are given as individual dot plots with median and interquartile range.


