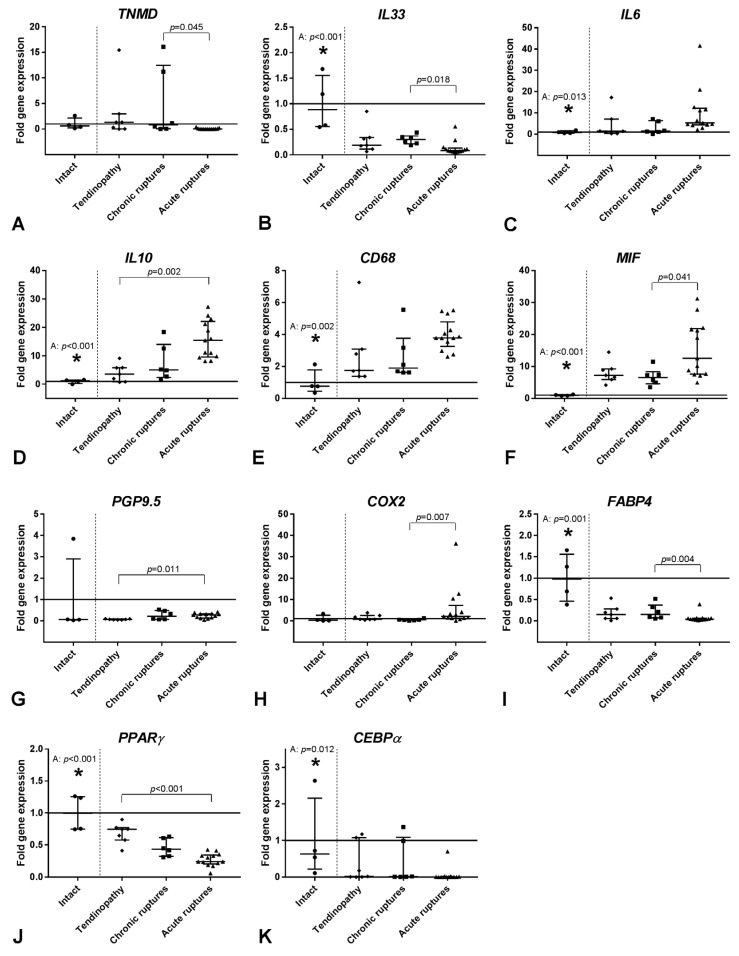
Figure 5.
Relative gene expression of TNMD (A), the inflammatory cytokines IL33, IL6 and IL10 (B–D), the immune cell marker CD68 (E), the nerve markers MIF and PGP9.5 (F–G), the pain marker COX2 (H), and the fat markers FABP4, PPARγ and CEBPα (I–K) in tendinopathic tendons, chronic ruptures and acute ruptures given as fold to intact tendon tissue (horizontal line, mean value = 1). qRT-PCR data were normalized to the expression of the house keeping gene 18S rRNA with efficiency correction and presented as fold change to the mean of the intact tendons. Results are shown as individual dot plots with median and interquartile range. Significant differences between the intact tendons and the three tendon pathology groups are marked with a star (*) above the intact tendon and the respective significant group (T: tendinopathy, C: chronic ruptures, A: acute ruptures) and the p-value. The vertical dashed line separates the intact group from the tendon pathology groups. Significant differences between the three tendon pathology groups are marked with a spanning line above the groups and the individual p-values. p ≤ 0.05 was considered as statistically significant.

