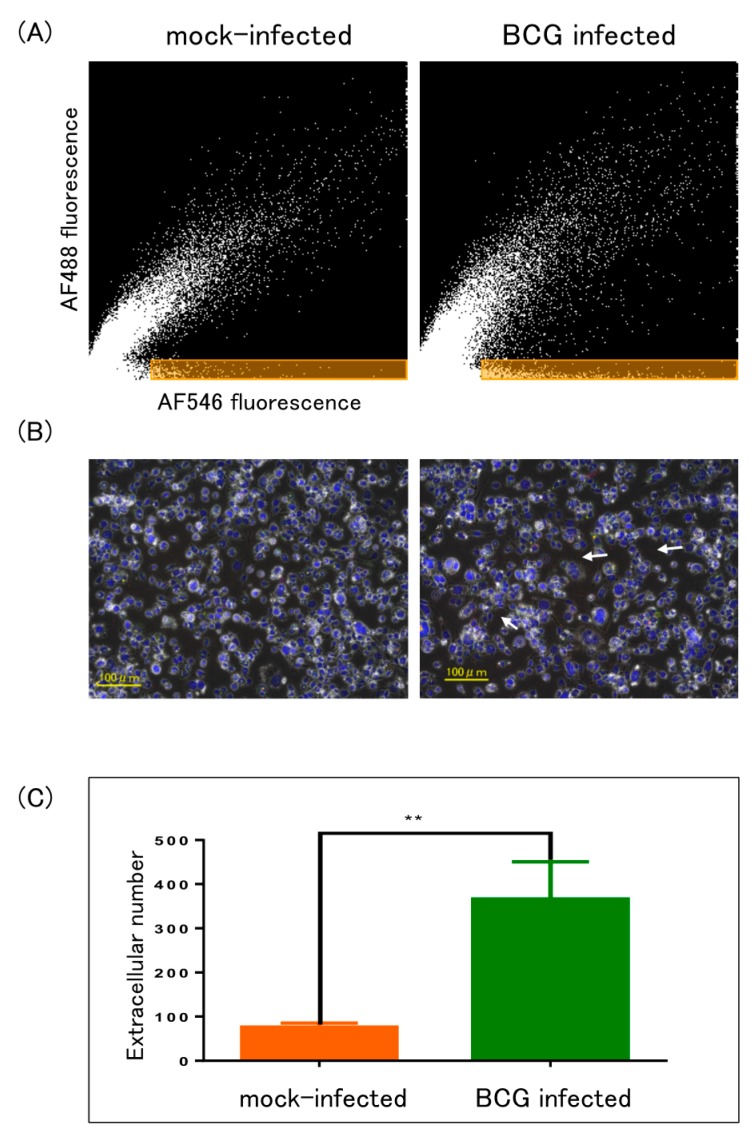
Figure 4.
Enumeration of extracellular signals. Fluorescence intensity of O-17 and 10A16 were analyzed by Hybrid cell count module. (A) Extracellular signals were highlighted in orange area of scattergrams drawn based on Figure 3(A-4, B-4), respectively. X-axis and Y-axis indicate 10A16 and O-17 fluorescence intensity, respectively; (B) phase contrast image was overlaid onto fluorescent image of Figure 3(A-3, B-3), respectively. Arrows indicate apparent extracellular signals of 10A16; (C) the extracted numbers of extracellular 10A16 signals in orange area of BCG-infected and mock-infected cells were compared. ** p < 0.01, t test done by prism software.

