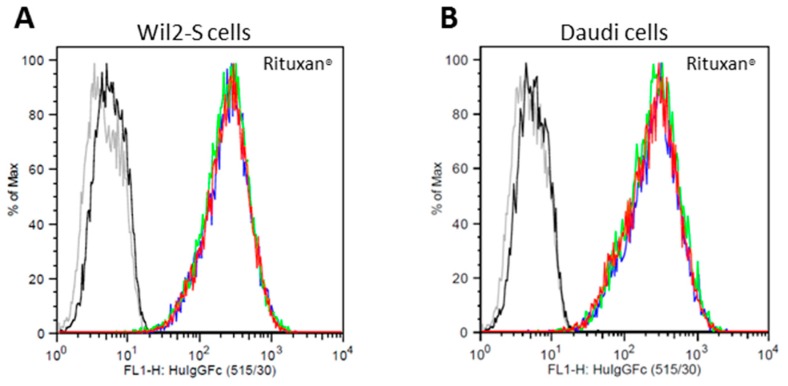
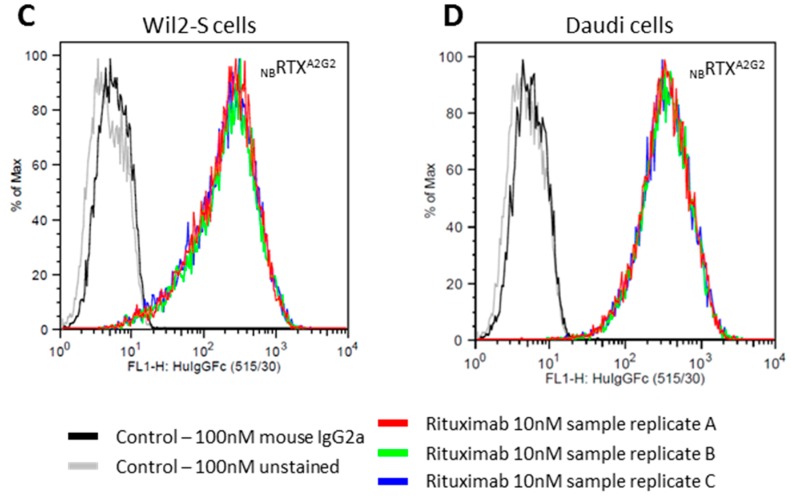
Figure 4.
Binding of Rituxan® (A,B) and NbRTXA2G2 (C,D) to Wil2-S and Daudi cells analyzed by flow cytometry. Rituxan® and NbRTXA2G2 were used at a concentration of 10 nM. All rituximab samples were measured in triplicates (red, green and blue lines). FITC-labeled mouse IgG2a (black line) and unstained cells (grey line) were used as controls. The X-axis represents the fluorescent signals of FITC whereas the Y-axis presents % of cell count.


