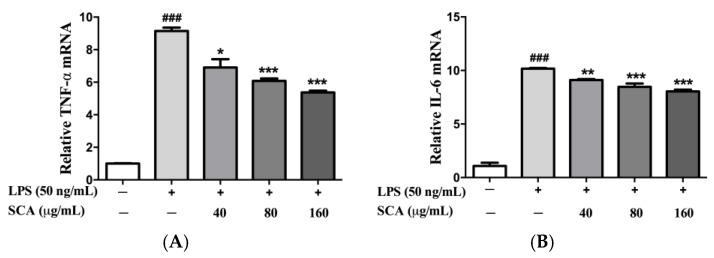
Figure 4.
Effects of SCA on TNF-α (A) and IL-6 (B) mRNA expressions. RAW 264.7 macrophages were treated with SCA (40, 80 and 160 μg/mL) for 1 h and then stimulated with LPS (50 ng/mL) for 24 h. The TNF-α and IL-6 mRNA expressions were analyzed by real-time PCR. * p < 0.05, ** p < 0.01 and *** p < 0.001 versus LPS-only treatment group; ### p < 0.001 versus control group.

