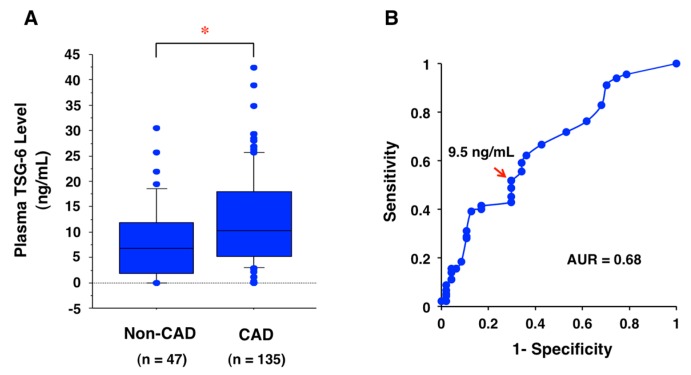
Figure 5.
Biomarker of CAD using plasma TSG-6 levels at the onset of acute coronary syndrome. (A) Plasma TSG-6 levels are significantly higher in 135 CAD patients than 47 non-CAD subjects. Data are shown as median (center line in box) with 25th percentile (lower line of box), 75th percentile (upper line in box), 10th percentile (bars below box), and 90th percentile (bars above box). Unpaired Student’s t test was used for statistical analysis. * p = 0.0013. The graph was modified from the graph shown in our previous report (Watanabe et al., Atheroprotective Effects of Tumor Necrosis Factor–Stimulated Gene-6; JACC: Basic to Translational Science, 2016, 6, 494–509, permitted by Elsevier) [10]. (B) The receiver operating characteristic (ROC) curve analysis indicates the cutoff value of plasma TSG-6 for detecting CAD. The arrow shows the cutoff value (9.5 ng/mL) chosen to gain a relatively higher true-positive rate (sensitivity) with a lower false-positive rate (1-specificity). The area under the curve (AUC) value is 0.68. The results are unpublished data from our previous study [10].

