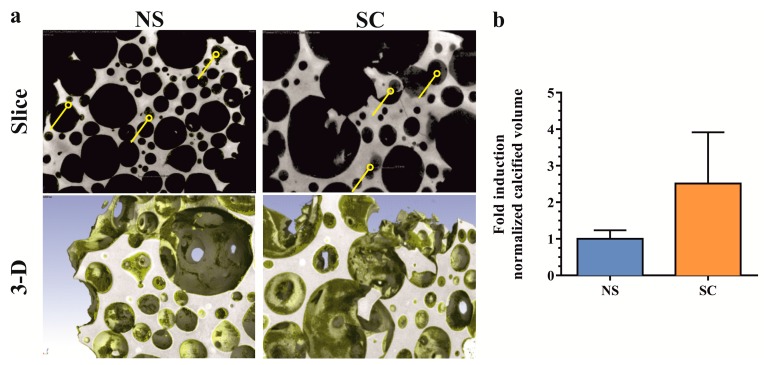
Figure 3.
Quantification of de novo calcified tissue by micro-computed tomography. (a) Evidence of de novo calcified tissue formed in scaffold pores (arrowheads, upper panels). Three-dimensional visualization of ceramic (grey) and de novo calcified tissue (yellow) in explanted scaffold (lower panels). (b) Quantification of calcified tissue volume normalized by scaffold pore volume. Values are expressed as fold induction over non-sclerotic samples (means + SEM, n = 3 donors, duplicate implantations). NS: non-sclerotic, SC: sclerotic.

