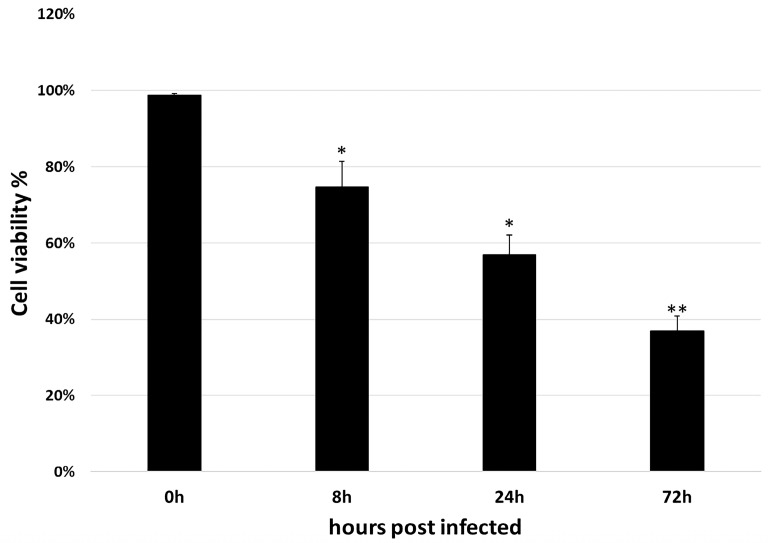
Figure 2.
Cell viability assay after infected with GCRV. After 0, 8, 24 and 72 h post infection, cells were evaluated using CCK-8 assay, respectively. The mean of three replicates was shown with the ±standard deviation (S.D.). Significant difference between the control and treated group was indicated with asterisks (*: p < 0.05; **: p < 0.01)

