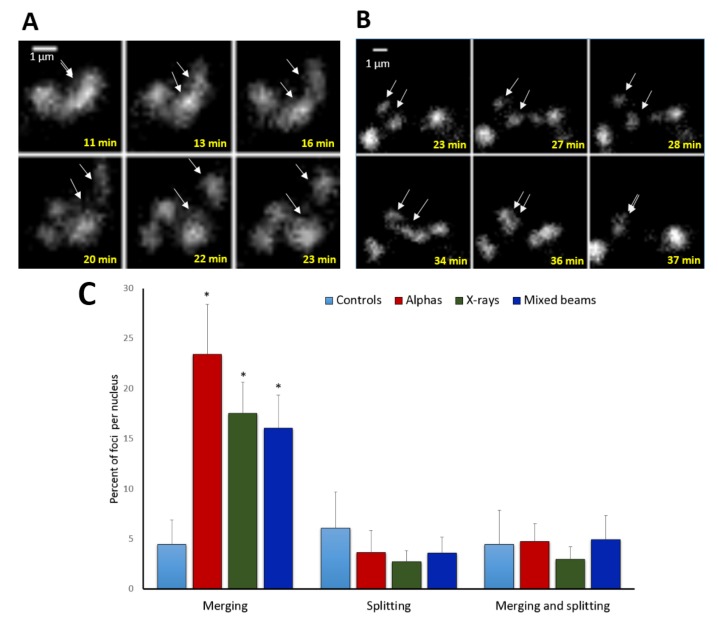
Figure 4.
Examples of focus splitting (A), merging (B), and statistics (C). Arrows mark foci that split or merge. (A) foci induced by X-rays, (B) foci induced by alpha particles; (C) frequency of focus merging and splitting events per nucleus. “Merging and splitting” refers to foci that exhibited both behaviours. White arrows point at sites of foci splitting and merging. Error bars: standard deviation. * significant differences to control (one way ANOVA).

