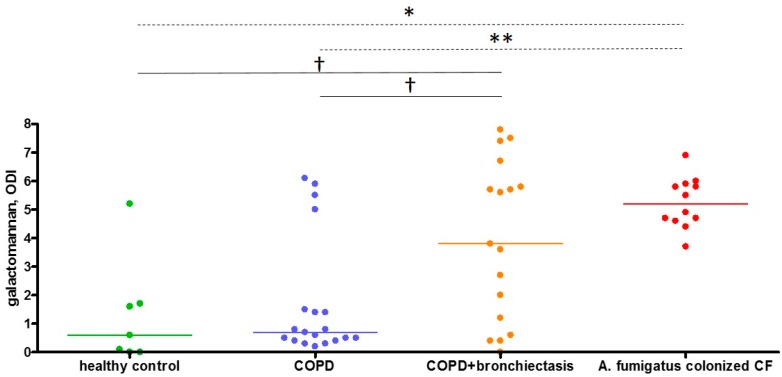
Figure 3.
Comparison of COPD sputum galactomannan with healthy and A. fumigatus-colonized CF controls. Sputum galactomannan is presented as optical density index. Every dot represents one sample, and the horizontal lines reflect the median values. Kruskal–Wallis test showed an overall significant difference (p = 0.0012), with Dunn’s post-hoc comparison for multiple testing showing significant differences between groups, indicated with * p < 0.05 and ** p < 0.01 (dashed lines). The comparison of COPD + bronchiectasis with the other groups using Mann–Withney U-test showed significant differences between groups, indicated with † p < 0.05 (solid lines). ODI: optical density index, COPD: chronic obstructive pulmonary disease, CF: cystic fibrosis.

