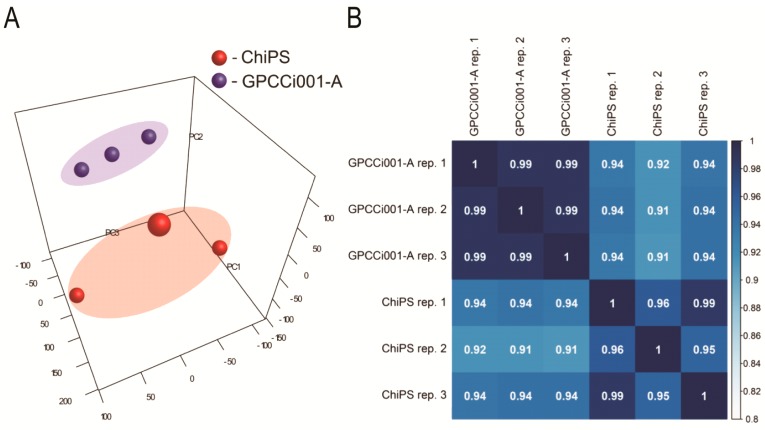
Figure 2.
Microarray data analysis. (A) Principal Component Analysis (PCA) plot shows two distinct clusters: human induced pluripotent stem cells (hiPSCs) (GPCCi001-A cell line) (blue bubbles located into the blue area) and ChiPS generated from hiPSCs via chondrogenic differentiation in vitro (red bubbles located into the red area). To further investigate the expression differences/similarities between investigated cells (ChiPS vs. GPCCi001-A) Pearson’s correlation coefficient analysis of datasets (PC1—Principal Component 1; PC2—Principal Component 2; PC3—Principal Component 3) (B) was performed.

