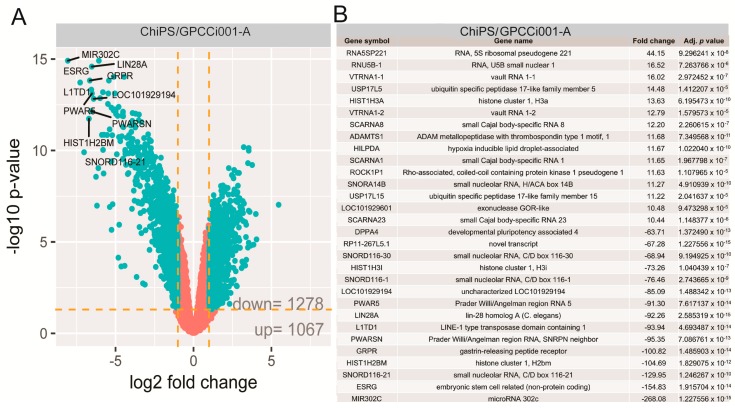
Figure 3.
Volcano plots show the total gene expression profiles of the ChiPS and GPCCi001-A experimental groups. Each dot represents the mean expression level (n = 3) of a single gene obtained from a microarray normalized dataset. The orange dotted lines (cut off values) were established according to the following parameters: fold > |2| and adjusted p-value < 0.05. Genes above the cut-off are considered to be differentially expressed and are shown as blue dots. The total number of differentially expressed genes are displayed in the bottom right corner of the graph. The top ten most up- and down-regulated genes are described by their gene symbols (A). The table shows the 30 genes with the highest (15 genes) and lowest (15 genes) fold changes obtained from the list of differentially expressed genes (B).

