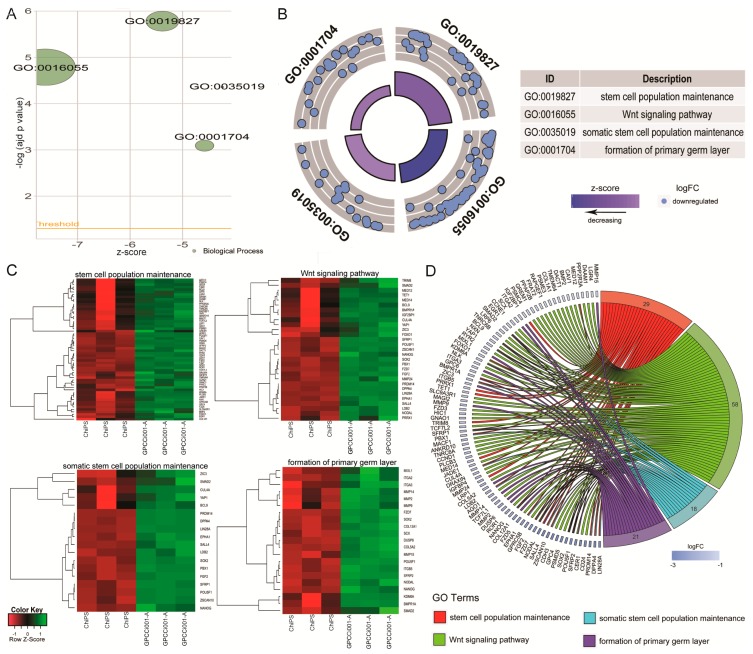
Figure 4.
Bubble plot of four significantly-enriched Gene Ontology (GO) terms related to pluripotency regulation and differentiation, which were: “stem cell population maintenance”, “Wnt signalling pathway”, “somatic stem cell population maintenance”, and “formation of primary germ layer”. The negative logarithm of the adjusted p-value from all analyzed GO terms is given on the y-axis, while the Z-score value is shown on the x-axis (A). The circular scatter plot shows the differentially expressed genes assigned to each GO term. The logarithm of the fold change value (logFC) of differentially expressed genes is shown (B). Heat map graphs of genes from the following GO terms: “somatic stem cell population maintenance”, “stem cell population maintenance”, “formation of primary germ layer”, “Wnt signalling pathway”. Arbitrary signal intensity acquired from the microarray analysis is represented by the colours (green—higher; red—lower expression). Log2 signal intensity values for any single gene were resized to Row Z-Score scale. Genes belonging to the relevant GO term are described by their symbols (C). Circos plot demonstrating relationship between selected GO terms and their genes. Genes are located on the left side of the graph and indicated by their symbols. Genes were ordered based on their logFC values. Gene involvement in the GO terms was determined by connecting lines (D).

