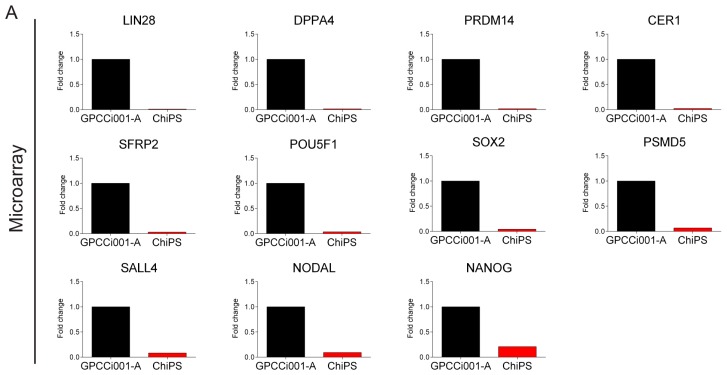
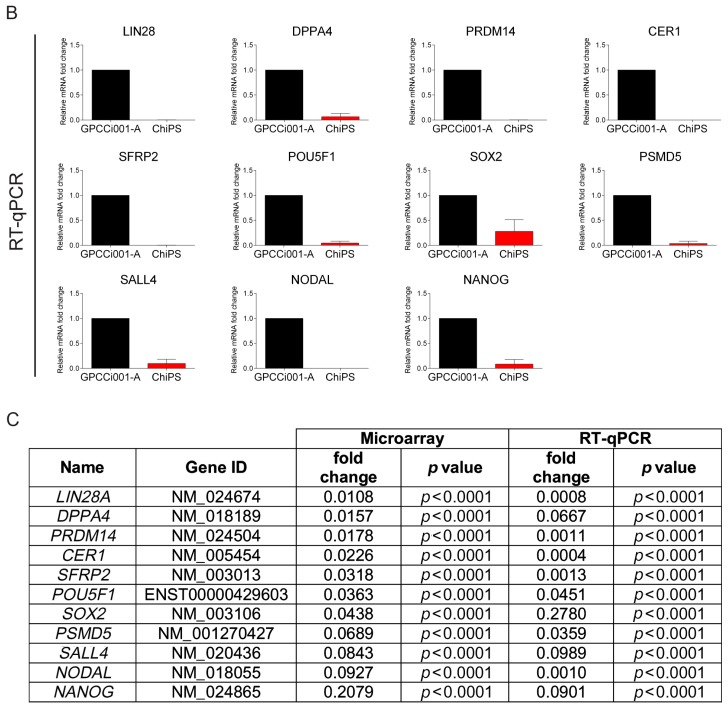
Figure 5.
Real time qPCR validation of microarray data. For validation, we selected the most highly expressed genes according to the Circos plot GO terms. The top panel represents normalized GPCCi001-A cell line fold changes of selected genes based on microarray data (A). The bottom panel represents microarray data validated by RT-qPCR. The graph represents means ± SD from three independent experiments (B). The table representing normalized to GPCCi001-A fold changes and p-values of selected genes from microarray and RT-qPCR analysis (C).


