Figure 1.
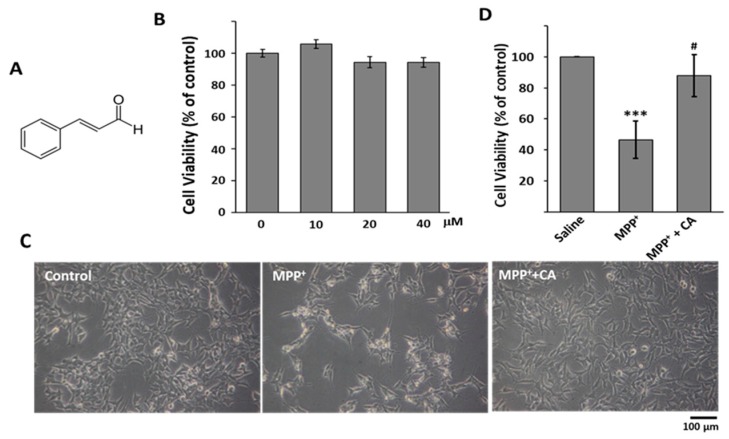
The effects of CA on MPP+-induced cell death. (A) The chemical structure of CA; (B) BE(2)-M17 cells were incubated with the indicated concentration of CA for 48 h. The data are expressed as the means ± standard deviation (S.D.) of three independent experiments; (C) 0.5 mM MPP+ was added to cells with 10 μM of CA for 48 h. Photos of cells were taken as indicated; (D) The live cell number was counted, and the data are expressed as the means ± S.D. of three independent experiments. *** p < 0.001 versus control; # p < 0.05 versus MPP+-treated cells.

