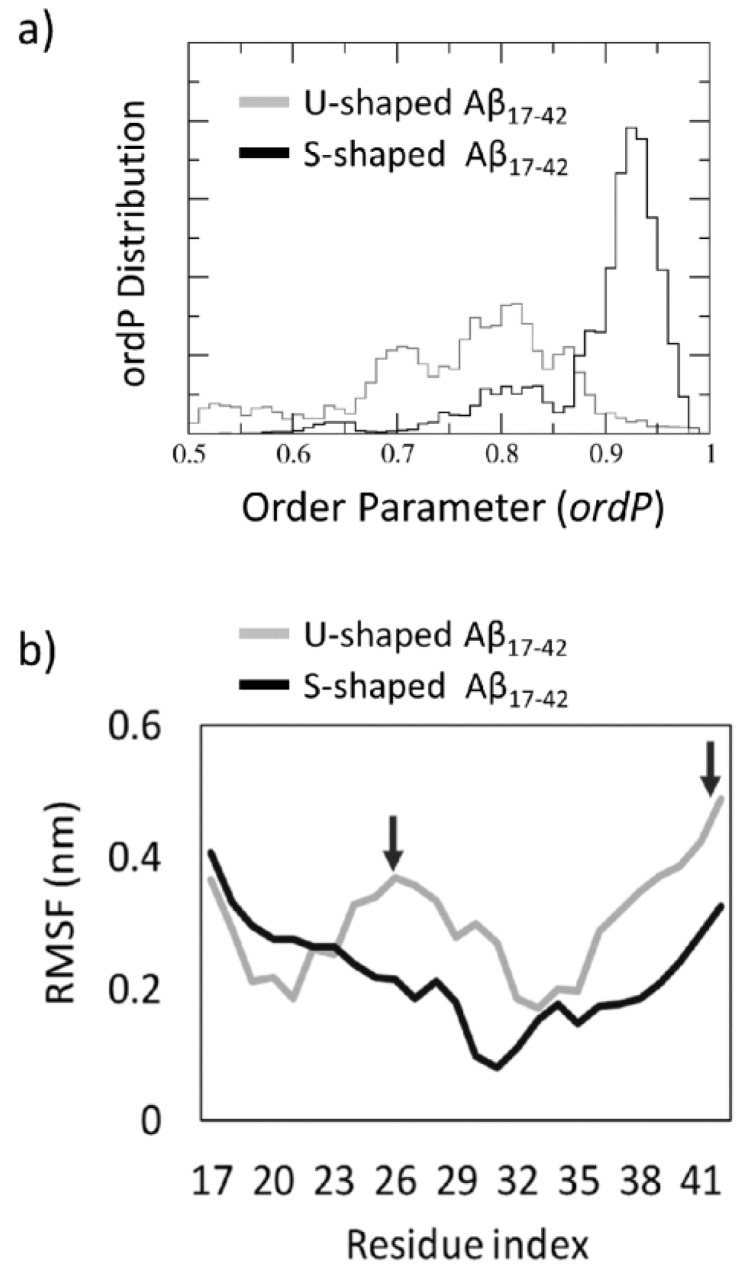
Figure 4.
(a) Order Parameter, ordP, distribution calculated throughout the overall REMD trajectory at 300 K. The same number of snapshots was considered for both U-shaped (grey line) and S-shaped (black line) models. The ordP value provides a quantitative estimation of the fibril order. Values close to 1 indicate an alignment close to the starting structure, i.e., aligned fibre along the fibril axis. Values lower than 1 indicated a structure distortion; (b) Root Mean Squared Fluctuation (RMSF) plot calculated over the REMD trajectory at 300 K filtered on the ensemble weighted Maximally Correlated Motion (ewMCM) vector. Black arrows indicate residues with the highest RMSF in central and C-terminal regions of the U-shaped model.

