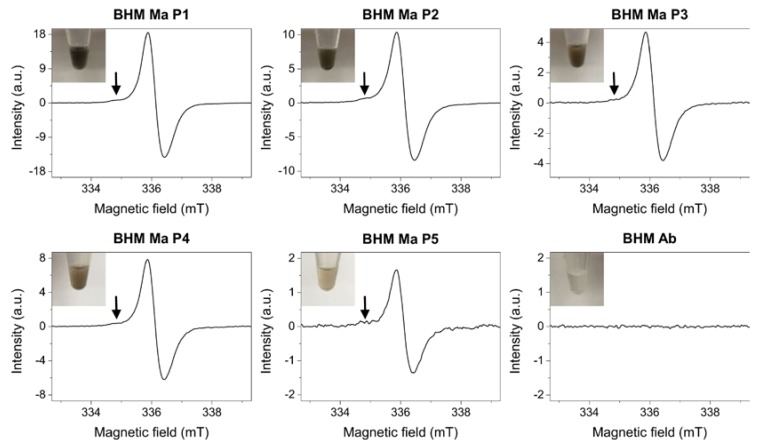
Figure 1.
Electron paramagnetic resonance (EPR) spectra of cells examined in this work. Arrows indicate the lower field component attributed to the pheomelanin pigment. Signal intensities are extended to maximum to better show the contribution of pheomelanin component to the EPR melanin spectra. Although the pheomelanin signal seems almost negligible it is worth noting that the detection sensitivity of EPR for pheomelanin determination is nearly an order of magnitude lower than that of eumelanin making the overall contribution of this pigment substantial. Insets show images of cell pallets taken before the analysis.

