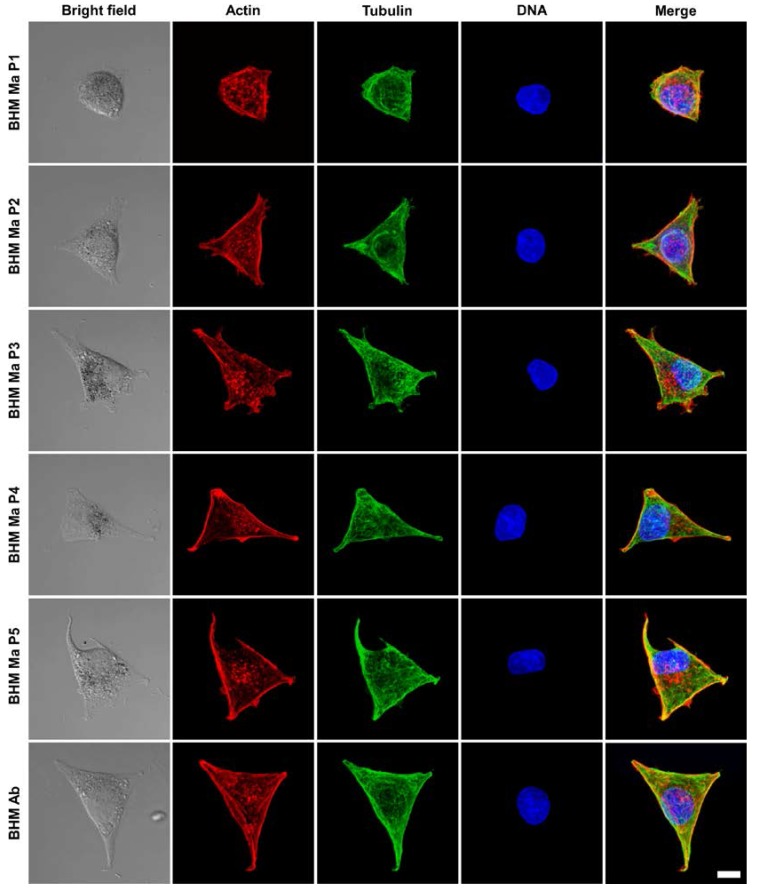
Figure 3.
Representative confocal microscopy images of the examined cells. Scatter laser light images (first column from the left) showing the morphology of the cells followed by fluorescence images (remaining columns) of the cells’ cytoskeleton shown in the maximum intensity projection mode. Scale bar for all images represents 10 µm.

