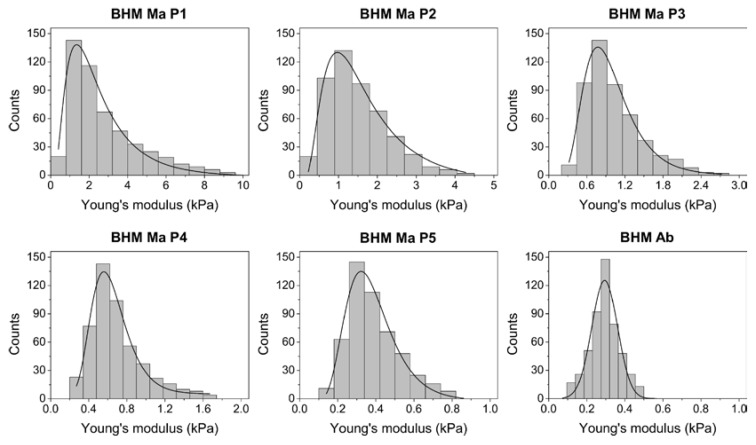
Figure 4.
Histograms of the Young’s modulus values for the examined cells. Solid lines represent function fit to the data. In the case of BHM Ma cells, log-normal function was fitted, whereas for BHM Ab cells the Gaussian function was fitted. Note that the Young’s modulus data for BHM Ma cells becomes narrower and shifts towards lower values after each consecutive passage.

