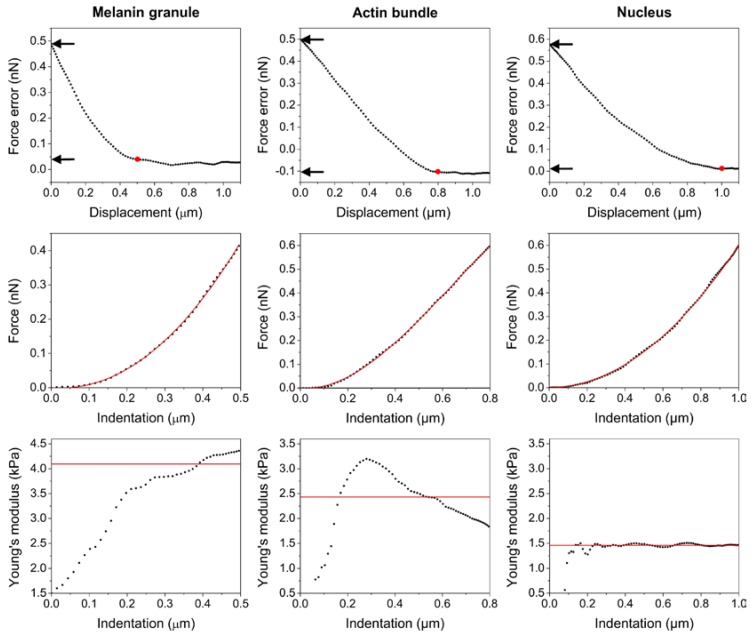
Figure 6.
Representative force curves pulled from elasticity map for three different locations on the cell. Force error–displacement curves (upper row), followed by force–indentation curves (middle row) and Young’s modulus–indention curves (bottom row). Red dots in force error–displacement curves represent the point of contact of the AFM tip with the cell. Arrows point to the values of force on the y axis, which correspond to both minimum force (contact point) and maximum force (last point on the curve). Red lines in force–indentation curves represent fit of the theoretical model to the data points. Solid lines in pointwise modulus data represent the average values of the Young’s modulus calculated for each position. Note that the indentation depth differs significantly between the positions. It is lowest for a melanin granule and highest for the nucleus.

