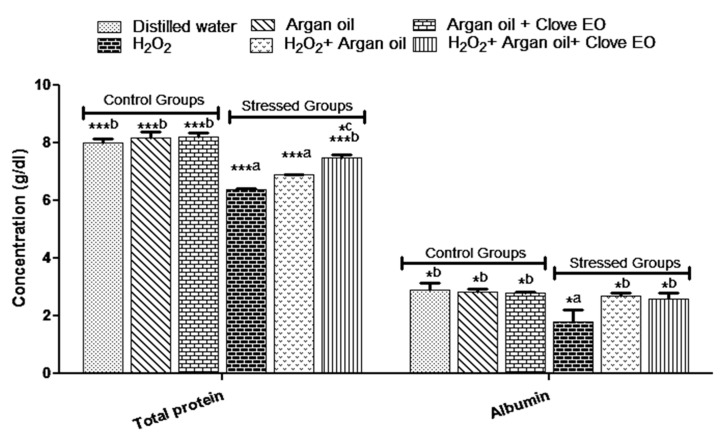
Figure 2.
Effect of the interventions on total protein and albumin levels. a: comparison between distilled water group and all groups. b: comparison between H2O2 group and all groups, c: comparison between H2O2 + Argan oil and H2O2 + Argan oil + clove essential oil. * p < 0.05, *** p < 0.001. Data are the means of three replicates (n = 3) and presented as mean ± SD.

