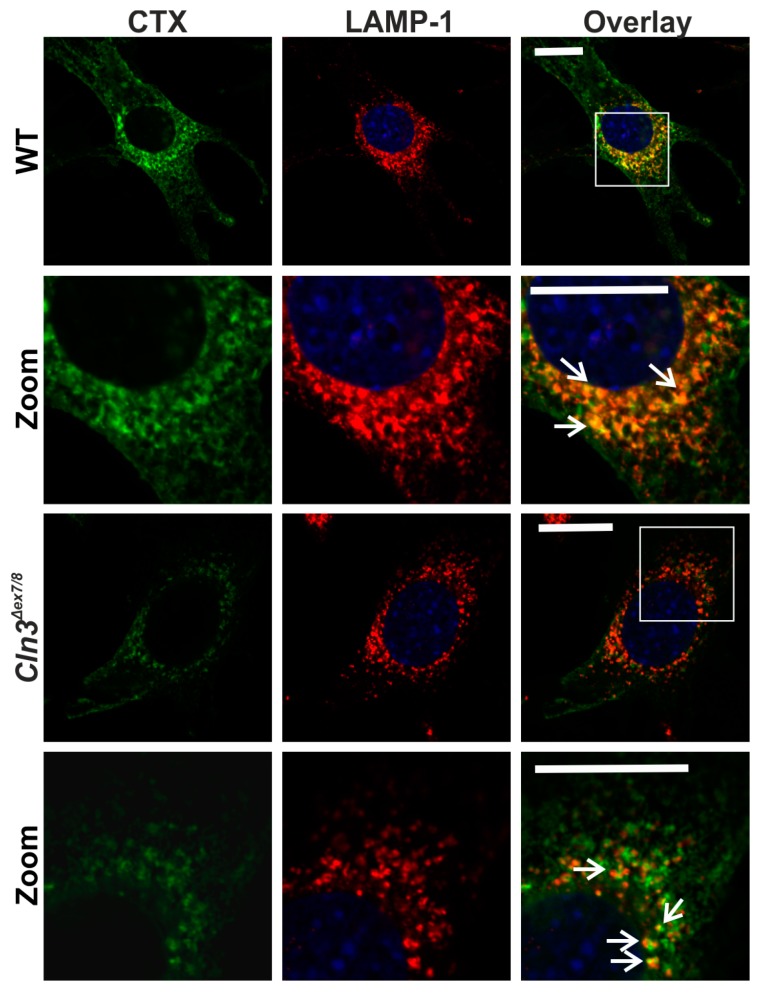
Figure 5.
GM1a partially colocalizes with lysosomes in both WT and Cln3Δex7/8 cells. The cells were stained with CTX-A488 (green) and anti-LAMP1 antibody (red) and imaged using a confocal microscope. Second and bottom row show an enlargement of the perinuclear area, depicted by a white frame in the overlay images on the first and third rows, respectively. Arrows point to examples of colocalization. The green signal in the overlay image of the Cln3Δex7/8 cells was enhanced using the “best fit” function of the Zeiss Zen software to better depict the colocalization. Scale bar: 20 µm. Images show representative data from 3 independent experiments.

