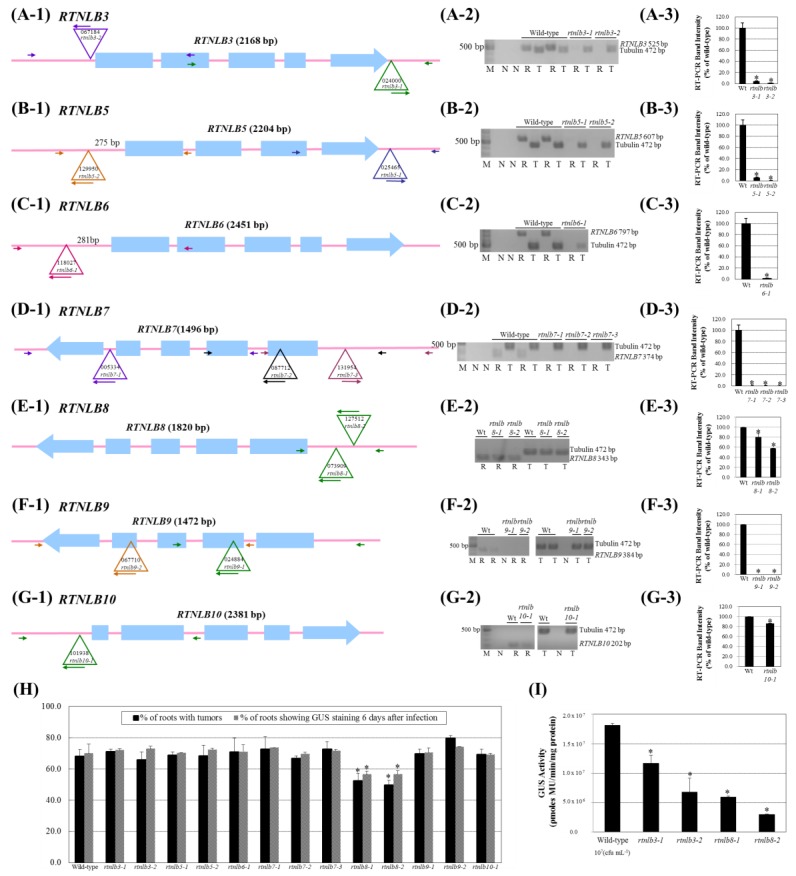
Figure 3.
The Arabidopsis rtnlb3 and rtnlb8 T-DNA insertion mutant seedlings were resistant to A. tumefaciens infection. Panel A, schematic representations of the T-DNA insertion regions around the Arabidopsis RTNLB3 (Panel A-1), RTNLB5 (Panel A-2), RTNLB6 (Panel A-3), RTNLB7 (Panel A-4), RTNLB8 (Panel A-5), RTNLB9 (Panel A-6), and RTNLB10 (Panel A-7) genes. Blue boxes represented exon regions of each RTNLB gene. The large open triangle represents T-DNA insertion sites in each RTNLB gene. The long and short arrows indicate the locations of primers used in genomic DNA PCR analysis. Panel B, RT-PCR results of target RTNLB transcripts in rtnlb3 and rtnlb5-10 single mutants. The α-tubulin was an internal control. Panel C, transcript levels of each RTNLB gene in rtnlb single mutants shown as a relative percentage of wild-type plants. Data are mean ± SE from at least 3 RT-PCR reactions of each mutant. Panel D, transformation efficiencies of rtnlb8-1 and rtnlb8-2 and wild-type plants. Black bars indicate the percentage of root segments forming tumors 1 month after infection with 108 cfu·mL−1 tumorigenic A. tumefaciens A208 strain. Grey bars show the percentage of root segments with GUS activity 6 days after infection with 108 cfu·mL−1 A. tumefaciens At849 strain. Panel E, rtnlb3 and rtnlb8 mutant seedlings showed decreased susceptibility to transient transformation. Transient transformation efficiency in mutant seedlings infected with 107 cfu·mL−1 acetosyringone (AS)-induced A. tumefaciens strain for 3 days. Data are mean ± SE. * p < 0.05 compared with the wild-type by pairwise Student’s t test.

