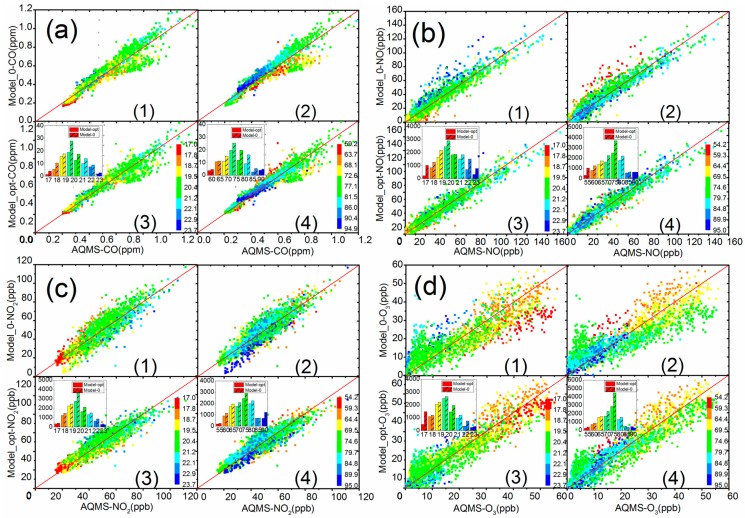
Figure 9.
Scatter plot of AQMS and sensor data by Model 0 and corrective Model-opt. (a) CO, (b) NO, (c) NO2, (d) O3. Insets represent the cumulative errors in each temperature and relative humidity bin. Subplots 1 and 3 are color categorized plots by temperature for Model 0 and Model-opt, respectively. Subplots 2 and 4 are color categorized plots by relative humidity for Model 0 and Model-opt, respectively.

