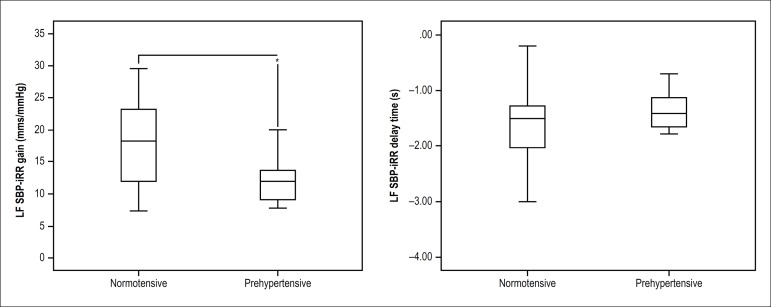
Figure 2.
LF SBP-iRR gain and LF SBP-iRR delay time; Data represented in Box plot (minimum value, first quartile, median, third quartile and maximum value); iRR: RR interval; SBP: systolic blood pressure; LF: low frequency; Unpaired Student t test: *: significant difference in relation to the normotensive group (p = 0.03).

