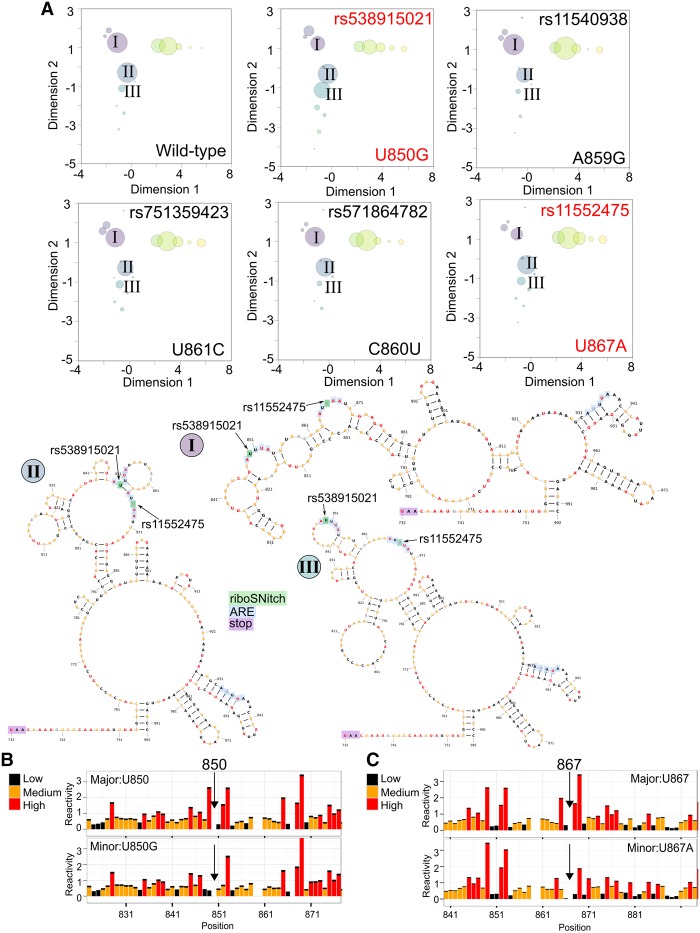
FIGURE 5.
The riboSNitches rs538915021 and rs11552475 alter the proportions of the 3′ UTR TPT1 mRNA structure clusters. (A) The SHAPE-guided structural ensemble for the reference sequence (control) is shown next to two riboSNitches (U850G and U867A). The riboSNitch U850G (rs538915021) causes an increase in population of the III cluster. The riboSNitch U867A (rs11552475) causes a decrease in the population of the I cluster. Three nonchangers are shown below (rs11540938, rs571864782, and rs751359423) that all occur within the same region. (I–III) Three representative medoid secondary structures are shown. Each cluster is labeled in the ensemble plots. The nucleotides in all structures are colored by WT SHAPE reactivity. (B,C) Comparison of normalized SHAPE data for the major and minor allele of the riboSNitches U850G (rs538915021) and U867A (rs11552475).

