FIGURE 2.

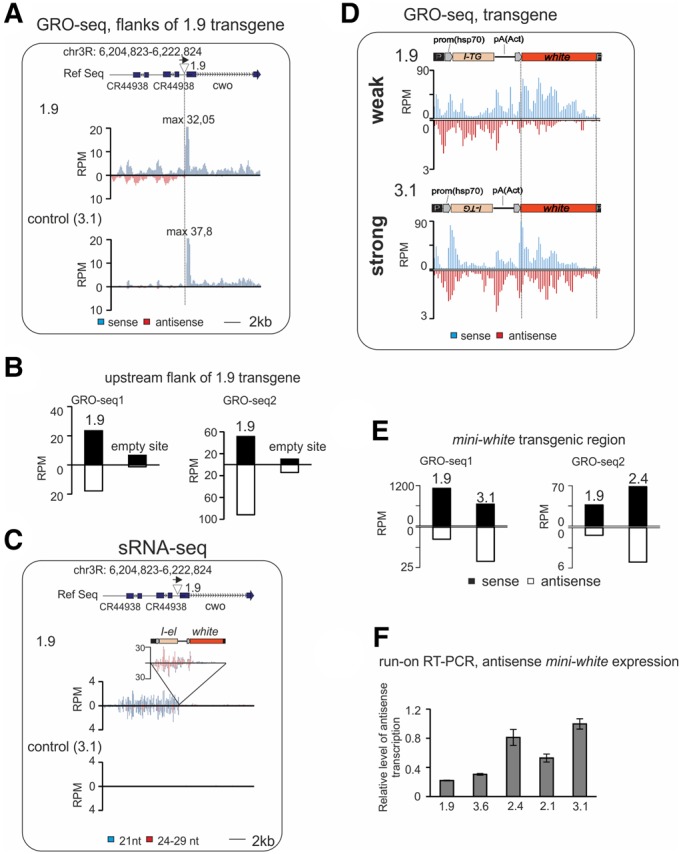
Transcriptional changes accompany piRNA cluster formation. Analysis of GRO-seq made on ovaries of transgenic strains. (A) Normalized GRO-seq densities mapping to the 1.9 transgene insertion site (indicated by triangle above the plots) in control (3.1) and in 1.9 strains (no mismatches allowed). Schema of genomic region is shown above; genome coordinates are given according to Drosophila R5 release. (B) GRO-seq read counts at the 9 kb region upstream of the 1.9 insertion site in 1.9 and 3.1 (GRO-seq1) and in 1.9 and 2.4 (GRO-seq2) strains. (C) Mapping of normalized small RNA reads (no mismatches allowed) to the 1.9 transgene insertion region in control (3.1) and in 1.9 strains. Sense and antisense reads are shown above or under the x-axis, respectively. Bars corresponding to endo-si RNA (21 nt) and piRNA (24–29 nt) fractions are colored in blue and red, respectively. (D) Mapping of normalized (RPM) GRO-seq reads to the transgene calculated for 100 bp window size in strong (3.1) and in weak 1.9 strains (no mismatches allowed). Schemes of transgenes are shown above. (E) GRO-seq read counts at mini-white transgene region calculated for 1.9 and 3.1 (GRO-seq1) and 1.9 and 2.4 (GRO-seq2) strains. (F) The level of nascent mini-white antisense RNA is higher in ovaries of strong transgenic strains. Strand-specific RT-qPCR was done on ovarian run-on RNAs from indicated strains. Relative levels of normalized values are shown. Error bars represent SEM of three technical replicates.
