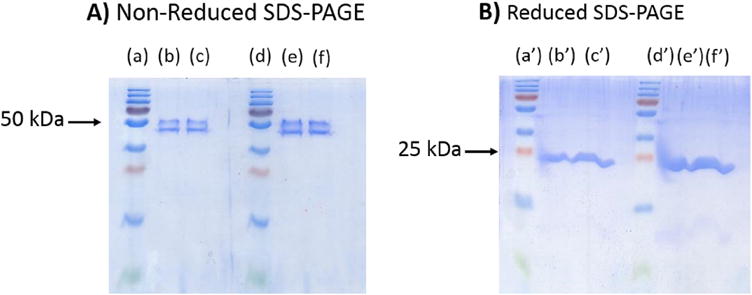
Fig. 1. SDS-PAGE analysis of different Fab fragment concentrations in non-reducing and reducing conditions.

A) Non-reduced SDS-PAGE gel. Lane (a) and Lane (d) are the protein standard ladders, Lane (b) 1 μg/μL Fab, Lane (c) 1.5 μg/μL Fab, Lane (e) 2 μg/μL, Lane (f) 3 μg/μL Fab. B) Reduced SDS-PAGE gel. Lane (a’) and Lane (d’) are the protein standard ladders, Lane (b’) 1 μg/μL Fab, Lane (c’) 1.5 μg/μL Fab, Lane (e’) 2 μg/μL, Lane (f’) 3 μg/μL Fab.
