
Fig. 3. SEC analysis.
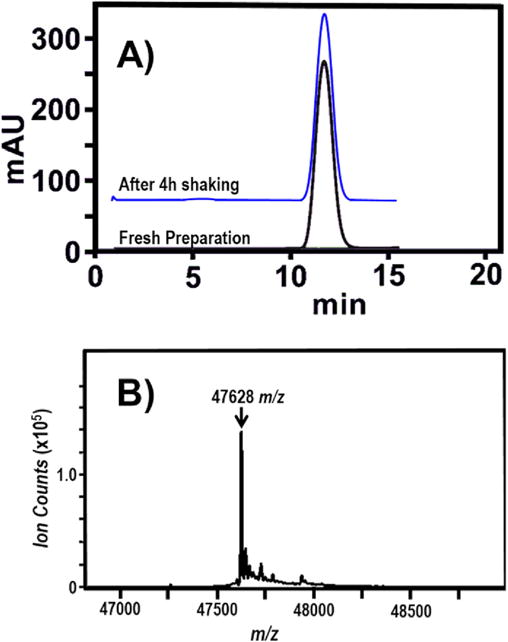
A) Lower trace: Size exclusion chromatograph (SEC) of freshly prepared Fab fragment (detector set at λabs = 280 nm) that displays a single eluent, corresponding to a ≈50 kDa product. Upper trace: SEC of the Fab fragment after shaking for 4 h at 23 °C on the platform of a vortex mixer (See text.). B) The deconvoluted electrospray quadrupole time-of-flight (ESI-Q-TOF) mass spectrum from effluent at the signal maximum of the SEC chromatography trace. Thedeconvoluted peak at 47,628 (±5) m/z, indicates a measured molecular weight for the Fab fragment of 4762 (±5) g/mol.