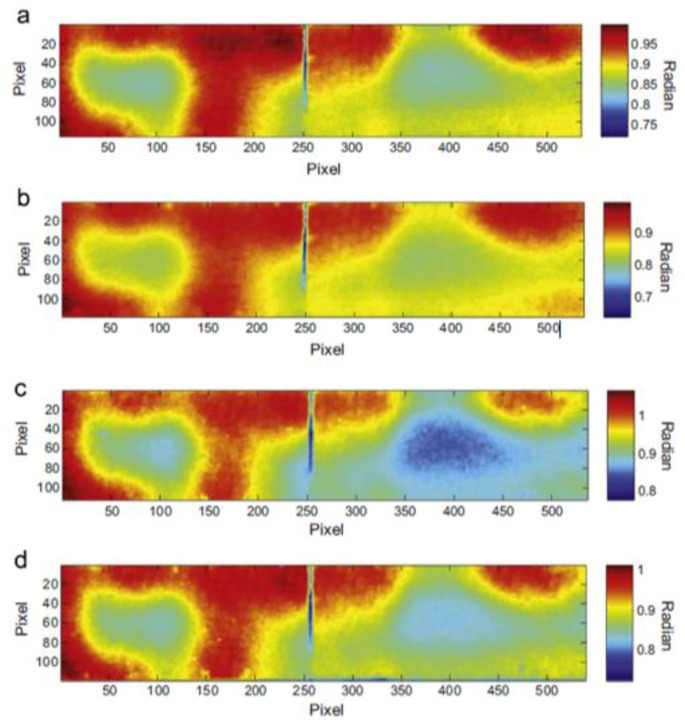
Figure 5.
PPT phase results on a single lap joints with CFRP adherends undergone to different fatigue loading cycles, with permission from [57]. Each subfigure corresponds to the thermal phase image of the composite sample after 200 cycles (a); 400 cycles (b); 400 cycles and pretension (c) and 600 cycles (d).

