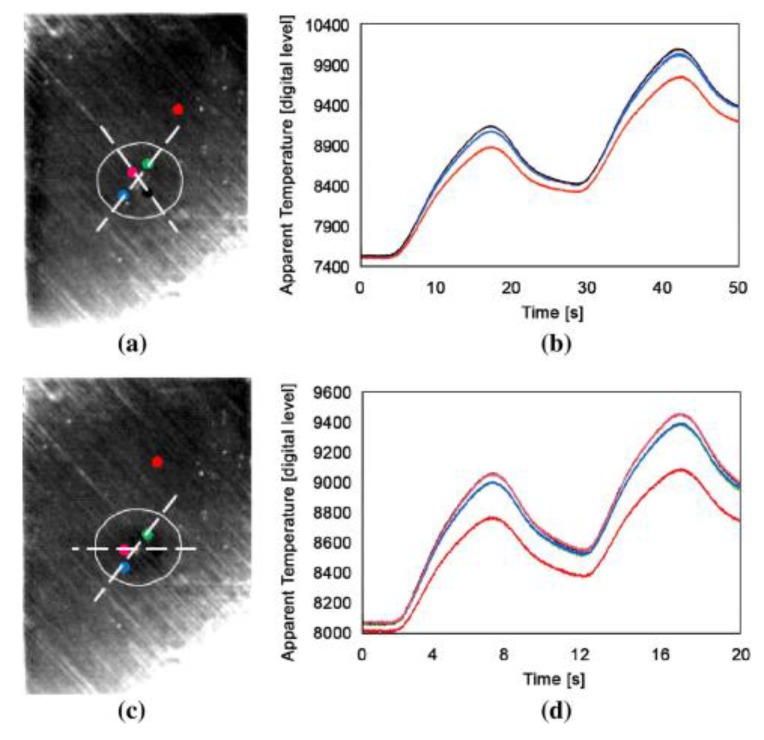
Figure 13.
Ultrasonic lock-in thermography results on a composite panel with BVID, with permission from. Figure (a,c) shows the lock-in results with delamination at −45° and +/−45°, and −45° and 90° respectively, whilst figure (b,d) illustrates the apparent temperature results at 0.04 Hz and 0.1 Hz, respectively. [110].

